Transcription of drought indices - DMCSEE
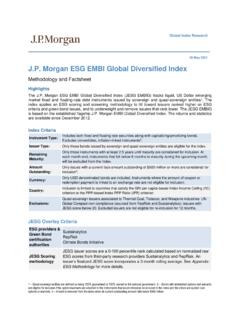
1 drought INDICESA ndrej CeglarBiotechnical faculty, University of Proceeding of precipitationdeficit throughout the hydrological cycle (Rasmusson, 1993)Influence of precipitation deficiency and other factors on drought development (National drought Mitigation Center) drought MONITORING Meteorological, agricultural and hydrological drought are often represented in sense of drought indices (simple to use, they absorb great amount of data about precipitation, snow pack, ground water ) Importance of time scale when accessing different types of drought Meteorological drought depends on precipitation deficit and duration of period with precipitation deficit Agricultural drought refers to situations with insufficient soil moisture level to meet the plant needs for water during vegetation period Hydrological drought occurs after longer period of precipitation deficit Choosing appropriate drought index: available information drought specific can we reproduce drought events (impact on vegetation, agriculture, water levels.)
2 Spatial scales (continental, national, regional, ..) drought MONITORING Large number of drought indices Meteorological drought (defined on the basis of degree of dryness) Simply expressed in terms of a rainfall deficit in relation to some average amount and duration of drought period. Definitions must be concidered as region specific (some definitions identify as number of days with precipitation less than some threshold value) Longer term rainfall time series available Standardised precipitation index (SPI), Palmer drought severity index (PDSI), Surface water supply index (SWSI), rainfall anomalies, Foley drought index, effective precipitation Important information for general public: how long the drought has lasted, how long the drought will last (seasonal weather forecasting), how much rainfall is needed to return to normal conditionsDROUGHT indices Agricultural drought .
3 Links various categories of meteorological and hydrological drought to agricultural impacts, focusing primarily on soil water deficits and differences between actual and potential evapotranspiration Situations with insufficient soil moisture level to meet the plant needs during growing season A good definition of agricultural drought should be able to account for the variable susceptibility of crops during different stages of crop development, from emergence to maturity Common interpretation of agricultural drought as physiological drought (water deficiency in plant cells when the soil and air contain the water in insufficient quantities) caused by an abrupt and marked increase in air temperature while soil temperature remains low Temporal variability of water availability (precipitation distribution during growing season) drought indices Assessment of agricultural drought requires calculation of water balance on weekly scale during growing season tools for calculating water balance tools for quantitative analysis of the growth and production of annual field crops indices , used in agriculture: Agrohydropotential (AHP), Dry daySequences, Generalized Hydrologic Model, Crop Moisture Index, Moisture Availability Index Hydrological drought .
4 Effects of periods of rain shortfall on surface and subsurface water supply They lag behind meteorological and agrometeorological droughts Groundwater drought is outlined by lower than average annual recharge for more than one year Groundwater levels are good indicators in an acquifer areaDROUGHT indices Considerations for drought indicators Suitability for drought types of concern include aspects of water demands, water supplies, drought vulnerabilities make sense for the context Data availability and consistency Are the data readily available? Is the indicator straightforward to calculate? Are the data thrustworthy? Does the value of index vary, depending on the source of data or method of calculation?
5 Many drought plans use indicators based on data, that are already collected, subjected to quality control and consistently reported. Clarity and validity readily understood and scientifically sound Temporal and spatial sensitivity Indicator levels that imply drought conditions for one time period or one region could imply wet/normal conditions for another time period or another region. Temporally and spatially specific Indicators need to be associated with a specific time period of calculation and need to define spatial scale of analysis, such as climate division, hydrological basin etc. drought indices drought progression and recession Getting into a drought and getting out of drought .
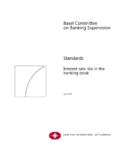
6 Linked with drought management and impact reduction goals Triggers can be set so that certain percentile will invoke responses that will produce a desired percentage reduction in water use drought indicator performance should also be considered (the degree of responsiveness or persistence desired in an indicator) Explicit combination methods drought plans rely on multiple indicators quantitative methods (most severe of the indicators, at least one of the indicators, majority of indicators) qualitative methods (convening a drought committe to determine when to implementresponses) Quantitative and quantitative indicators Indicators can be based on quantitative data or qualitative assessments, or both The importance of qualitative expertise should not be overlooked The understanding that a deficit of precipitation has different impact on groundwater, reservoir storage, soil moisture, snowpack and streamflow led to development of SPI (Mckee, Doesken and Kleist, 1993)* Most common drought monitoring index drought onset and duration Thom (1966) -> Gamma distribution fits precipitation sums well Examples of Gamma distribution functions:Standardized precipitation index* McKee, ; Doesken; and J.
7 Kleist. 1993. The relationship of drought frequency and duration to time scales. Preprints, 8th Conference on Applied Climatology, pp. 179 184. January 17 22, Anaheim, California. SPI procedure: Parameter estimation for Gamma distribution (based on least square method) frequency distribution of precipitation sums for station Parameters of Gamma distribution are determined for each station and time scale of interest (1 month, 2 months, ..) Thom (1966) determined parameters based on maximum likelihood method: Estimated parameters are then used for calculating cumulative probability distribution for a specific precipitation event, which has been observed on a defined time scale (e.)
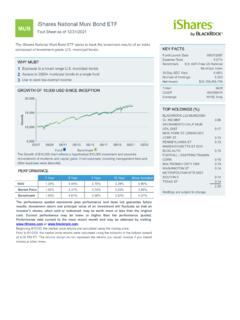
8 G. month): Gamma function is not defined at x=0 (but there is large number of no rainfall occurences as we move to shorter time scales); cumulative distribution is therefore modified to include these events:where q is the probability of no rainfall on specified time scaleStandardized precipitation index Cumulative probability distribution H(x) is then transformed into standardized normal distribution Z with the average equal to 0 and standard deviation 1; SPI is number of standard deviations left ( drought ) or right (wet) from 0 Panofsky in Birer (1958) transformation from given probability distribution into different probability distribution:probability that the value of variable is less than some value in defined probability distribution must be identical to probability of the transformed variable being less than transformed value in second probability distributionGamma distribution for august precipitation (Ljubljana, 1850 -2005)Transformation from cumulative probability distribution into standardized normal distributionStandardized precipitation index Transformtion of cumulative probability distribution H(x) into standardized normal distribution (Abramowitz in Stegun, 1965)
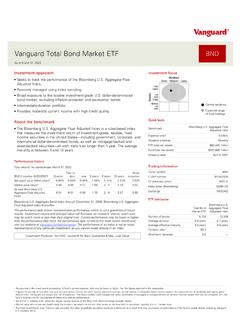
9 SPI has fixed expected value and standard deviation, which is a precondition for comparing index values between different locations or regions. Frequencies of extreme drought events are comparable between different represents number of standard deviations from < to drought -1 to drought0 to wet0 to to to >Probability (%)ClassificationSPIS tandardized precipitation indexDROUGHT indices SPI Different time scales reflect the impact of drought on the availability of the different water resources Mckee et al. (1993)* define a criteria for a drought event for any of the time scales drought event occurs any time the SPI is continuously negative and reaches an intensity of or less The event ends when the SPI becomes positive The positive sum of the SPI for all the months within a drought event => drought magnitude = =xjijSPIDM1 drought indices SPI SPI advantages: Simplicity (only rainfall data required for calculation) Variable time scale (meteorological, agricultural, hydrological drought ) Standardization (frequency of extreme drought events at any location and time scale are consistent) SPI disadvantages.
10 Suitable theoretical probability distribution, which can model raw data Extreme droughts (over longer period) occur with same frequency on all locations SPI can t identify drought prone regions Areas with small seasonal precipitation misleadingly large positive or negative SPI values may resultDROUGHT indices SPI (NDMC experience) SPI calibration period: how long period to use? There is no absolute best recommended calibration period Suggestion from NDMC (Nebraska): something like 50 years, ending around 2000; if you don t have as much data history, then adjustaccordingly What about stations with different lengths? normally NDMC uses entire period of record for each station if a person is trying to look at climate change and is comparing now to some future scenario period then use the same length of record for comparison purposes (example will be shown later on this presentation) when analyzing single station history, use all available (quality) data Issues that could be problematic: variability of precipitation and areal representativeness around a reporting stationDROUGHT MONITORING - PDSI Set of empirical relationships derived by Palmer (1965)* Palmer based his index on supply and demand concept of the water balance equation Objective.