Transcription of Duration Management / Return Strategies M O R G A N S T …
1 M O R G A N S T A N L E Y R E S E A R C HNorth AmericaMorgan Stanley & Co. LLCS ubadra (212) 761-2983 Changing Fixed-Income Landscape Challenges Faced by InvestorsBasics Components of ReturnsRelative Value Strategies to Enhance Returns Duration -Adjusted ReturnsWhere Are Recent Returns Coming From?Main TakeawaysDuration Management / Return StrategiesMarch 21, 2012 Interest Rate StrategyMorgan Stanley does and seeks to do business with companies covered in Morgan Stanley Research. As a result, investors should be aware that the firm may have a conflict of interest that could affect the objectivity of Morgan Stanley Research.
2 Investors should consider Morgan Stanley Research as only a single factor in making their investment analyst certification and other important disclosures, refer to the Disclosure Section, located at the end of this O R G A N S T A N L E Y R E S E A R C H2 Duration Management / Return StrategiesMarch 21, 2012 Changing Fixed-Income Investment LandscapeM O R G A N S T A N L E Y R E S E A R C H3 Duration Management / Return StrategiesMarch 21, 2012 Not the Same Bond Market Interest rates have been on a steady decline for 30 years. Reduced inflation risks due to Fed s credibility to combat inflation. Economic growth supported by countercyclical measure from the Fed.
3 Globalization a disinflationary Extraordinarily low interest rates in the US Unconventional policy actions by the Fed and global central banks. Global financial crisis and investor demand for safe haven assets. Fed pursuing monetary policy actions with the goal to raise inflation. Emerging Markets source of inflation. Fundamental change in the risk perception of government O R G A N S T A N L E Y R E S E A R C H4 Duration Management / Return StrategiesMarch 21, 2012 Challenges Faced by Investors Ultra low interest rates Compensated very little for taking on Duration risk. Makes taking Duration risk much less attractive than other forms of fixed-income risk.
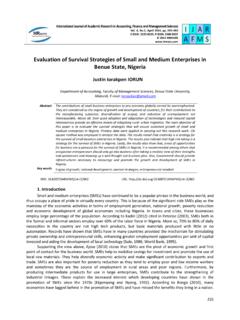
4 Dearth of spread products makes diversification difficult. How to limit exposure to sectors that do not offer attractive returns for risk. Hedge asymmetric risk. Unconventional policy actions by the Fed and global central banks. Central bank policy guessing game. Is there room left for further stimulus? Diminishing returns for incremental monetary action. Looming Deficits Fiscal austerity at time of sluggish growth. Regulatory environment Dodd Frank Basel III Deleveraging M O R G A N S T A N L E Y R E S E A R C H5 Duration Management / Return StrategiesMarch 21, 2012 Large Concentration of Low Yielding Assets 75% of the Citi BIG Index is in government-related securities.
5 Concentration of portfolio beta in low-yielding government debt. Significantly diminishes potential for alpha Products Dominate Traditional IndicesHigher-Yielding Credit Products Are a Smaller Piece of the Pie0%5%10%15%20%25%30%35%40%TreasuryAgen cySuprasMortgagesAssetBackedNon-USSovere ignCorporate75% of the Index market weight is in lower yielding rate productsCredit25%Treasury/Govt Sponsor44%Collateralized31%Source:Yieldb ook, Morgan Stanley ResearchM O R G A N S T A N L E Y R E S E A R C H6 Duration Management / Return StrategiesMarch 21, 2012 Income Cushion Is Shrinking In low rate environments, investors tend to extend out in Duration to seek returns.
6 But there is not enough income cushion to protect against a sell-off. Investors indexed to the BIG will start to incur capital loss if rates increase by Cushion Lowest since 1990 Longer Average Life but Smaller CouponsNote: Income cushion is akin to a break-even . It is a measure of how much yields have to move before coupon returns offset losses from a move higher in Mortgage Asset-BackedCreditCouponAverage Life050100150200250 Feb-90 Feb-95 Feb-00 Feb-05 Feb-10income cushion of just 40bpSource:Yieldbook, Morgan Stanley ResearchM O R G A N S T A N L E Y R E S E A R C H7 Duration Management / Return StrategiesMarch 21, 2012 Basics Understanding the Components of ReturnM O R G A N S T A N L E Y R E S E A R C H8 Duration Management / Return StrategiesMarch 21, 2012 The P&L at the end of a trade is roughlyBond P&L mark-to-market + CarryMark-to-market is the market price (PV) of the future cash flows.
7 Price Change is the biggest component of P&LCarry and Rolldown can enhance estimate the PNL of a long bond position in an unchanged yield curvewe calculate: Rolldown Carry Carry QuotientP(0) = today s priceP(t) = price at time (t)AI = Accrued Interestr = financing ratet = horizon dateP&L = [ P(t) + AI(t) ] [ P(0) + AI(0) x (1 + r * t/360) ]P&L = [ P(t) - P(0)] + Coupon * t/360 [P(0) + AI(0)] x r * t/360 Horizon PricePurchase Price GrowthPrice ChangeInterest IncomeFinancing costSource:Morgan Stanley ResearchBond P&LM O R G A N S T A N L E Y R E S E A R C H9 Duration Management / Return StrategiesMarch 21, 2012 RolldownAt horizon ( , in 3 months time for a 10y bond), the remaining instrument is a 9y9m anunchanged yield curve,the mark-to-market will be represented by the rolled-down rate.
8 We expect to make:In a positively sloped yield curve, the rolled-down rate is lower than the spot rolldown rr =If the Yield Curve Is Positively Sloped, Rolldown Is (years)RateA positively-sloped yield curve implies positive rate rolldown for a long bond position or receiving on swapsThe steepest areas of the curve have the greatest rate rolldownIn Treasuries: 5y and 7y Sectors Have the Best RolldownSource:Morgan Stanley ResearchM O R G A N S T A N L E Y R E S E A R C H10 Duration Management / Return StrategiesMarch 21, 2012 CarryThe carry for holding a bondis the cost of holding the bond to horizon date (say 3 months). Intuitively, for a bond, it s Carry = Coupon Received cost of financing the bondCoupon Received = Coupon * horizon days/actual days between coupon periodFinancing Cost = (Price + Accrued Interest) * (repo rate/360)Forward Price of BondctrtPPF +=P = today s priceF = forward pricer = financing ratet = time till the forward contractc = cost of carryBorrowing rateCarry rateIn Treasuries: 10y Has Best CarrySource:Morgan Stanley ResearchM O R G A N S T A N L E Y R E S E A R C H11 Duration Management / Return StrategiesMarch 21, 20121.
9 Carry as cash inflows minus outflowsThe carry for holding a 5y swapis the cost of holding the bond to maturity. Intuitively, for a bond, it s = Coupon Cost of Financing2. Carry as the hurdle rate (in bps running)A long bond position should profit as long as the forward rate at the horizon is less than the forward , spread between the spot rate and the forward rate tells us how much the rate can rise before the trade loses is the carry in bps Points RunningGiven a dollar value $X, the value in bps running is the value divided by the DV01 of the instrument (in our case, the 2y forward 5y swap).The DV01 is indicated above by This tells us the size of the forward rate move necessary to make or lose that ,2 Source:Bloomberg, Morgan Stanley ResearchCarry: Two RepresentationsM O R G A N S T A N L E Y R E S E A R C H12 Duration Management / Return StrategiesMarch 21, (years)Rate (%)Spot Rate06M Fwd RateRolldown: (years)Rate (%)Spot Rate06M Fwd RateCarry: 13bpSpot Curve6m Forward CurveQuantifying rolldown and carry: Expected earnings in a static yield curve environmentIn basis points running:Rolldown & Carry: Graphical Summary75,2carryrr =57rolldownrr =55,2 CRDrr =+Source.
10 Morgan Stanley ResearchM O R G A N S T A N L E Y R E S E A R C H13 Duration Management / Return StrategiesMarch 21, 2012 Spot 7y = 5y = = and Carry (2y) = 67bp + 90bp = 157bpVolatility (6m) = 114bp annualizedCarry Quotient = 157 / 228 = long- Duration trade profits if the horizon is below the forward big a move is needed for the trade to lose PNL?The rolldown and carry is presented in absolute bps. How do we judge how big that move is?We divide by volatility to compare across long as the rolled-down rate is below the forward, a long- Duration trade TradesThe daily realized volatility is calculated asRealized Volatility =+ 1021)(1 NiiirrNTo agree with the time to horizon, we multiply by the square root of the number of days to horizon.