Transcription of EC 823: Applied Econometrics - fmwww.bc.edu
1 Quantile regressionChristopher F BaumEC 823: Applied EconometricsBoston college , Spring 2013 Christopher F Baum (BC / DIW)Quantile regressionBoston college , Spring 20131 / 20 MotivationMotivationStandard linear regression techniques summarize the averagerelationship between a set of regressors and the outcome variablebased on the conditional mean functionE(y|x). This provides only apartial view of the relationship, as we might be interested in describingthe relationship at different points in the conditional distribution regression provides that to the conditional mean function of linear regression, wemay consider the relationship between the regressors and outcomeusing the conditionalmedianfunctionQq(y|x), where the median is the50thpercentile, or quantileq, of the empirical distribution.
2 The quantileq (0,1)is thatywhich splits the data into proportionsqbelow and1 qabove:F(yq) =qandyq=F 1(q): for the median,q= F Baum (BC / DIW)Quantile regressionBoston college , Spring 20132 / 20 MotivationIf iis the model prediction error, OLS minimizes ie2i. Medianregression, also known as least-absolute-deviations (LAD) regression,minimizes i|ei|. Quantile regression minimizes a sum that givesasymmetric penalties(1 q)|ei|for overprediction andq|ei|forunderprediction. Although its computation requires linear programmingmethods, the quantile regression estimator is asymptotically regression is more robust to outliers than least squaresregression, and is semiparametric as it avoids assumptions about theparametric distribution of the error F Baum (BC / DIW)Quantile regressionBoston college , Spring 20133 / 20 MotivationJust as regression models conditional moments, such as predictions ofthe conditional mean function, we may use quantile regression tomodel conditional quantiles of the joint distribution y(x)denote the predictor function ande(x) =y y(x)denote theprediction error.
3 ThenL(e(x)) =L(y y(x))denotes the loss associated with the prediction errors. IfL(e) =e2, wehave squared error loss, and least squares is the optimal (e) =|e|, the optimal predictor is the conditional median,med(y|x),and the optimal predictor is that which minimizes i|yi x i |.Christopher F Baum (BC / DIW)Quantile regressionBoston college , Spring 20134 / 20 MotivationBoth the squared-error and absolute-error loss functions aresymmetric; the sign of the prediction error is not relevant. If thequantileqdiffers from , there is an asymmetric penalty, withincreasing asymmetry asqapproaches 0 or of quantile regression (QR): while OLS can be inefficient ifthe errors are highly non-normal, QR is more robust to non-normalerrors and outliers.
4 QR also provides a richer characterization of thedata, allowing us to consider the impact of a covariate on the entiredistribution ofy, not merely its conditional , QR is invariant to monotonic transformations, such aslog( ), so the quantiles ofh(y), a monotone transform ofy, areh(Qq(y)), and the inverse transformation may be used to translate theresults back toy. This is not possible for the mean asE[h(y)]6=h[E(y)].Christopher F Baum (BC / DIW)Quantile regressionBoston college , Spring 20135 / 20 ImplementationImplementationThe quantile regression estimator for quantileqminimizes theobjective functionQ( q) =N i:yi x i q|yi x i q|+N i:yi<x i (1 q)|yi x i q|This nondifferentiable function is minimized via the simplex method,which is guaranteed to yield a solution in a finite number of the estimator is proven to be asymptotically normal with ananalytical VCE, the expression for the VCE is awkward to standard errors are often used in place of analytic F Baum (BC / DIW)Quantile regressionBoston college , Spring 20136 / 20 ImplementationThe Stata commandqregestimates a multivariate quantile regressionwith analytic standard errors.
5 By default the quantile is , the different quantile may be specified with thequantile() estimates the model with bootstrap standarderrors, retaining the assumption of independent errors but relaxing theassumption of identically distributed errors; thus they are analogous torobust standard errors in linear F Baum (BC / DIW)Quantile regressionBoston college , Spring 20137 / 20 ImplementationTheiqregcommand performs interquantile range regression:regression of the difference in quantiles. By default, the quantiles( , ) produce interquartile range estimates. Bootstrap standarderrors are produces QR estimates for several values ofqsimultaneously, allowing for differences between QR coefficients fordifferent quantiles to be tested.
6 Bootstrap standard errors F Baum (BC / DIW)Quantile regressionBoston college , Spring 20138 / 20 IllustrationIllustrationWe illustrate using data from the Medical Expenditure Panel Survey(MEPS), modeling the log of total medical expenditure for Medicare(elderly) patients. Explanatory variables include an indicator forsupplementary private insurance, a health status variable and threedemographic measures: age, female, and use mus03data, clear. drop if mi(ltotexp)(109 observations deleted). su ltotexp suppins totchr age female white, sep(0)VariableObs Mean Std. Dev. Min Maxltotexp2955 .5915398 .4916322 0 1totchr2955 0 7age2955 65 90female2955.
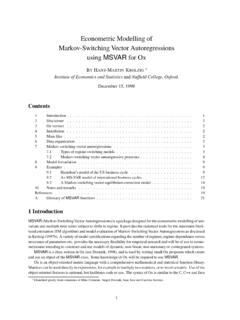
7 5840948 .4929608 0 1white2955 .9736041 .1603368 0 1 Christopher F Baum (BC / DIW)Quantile regressionBoston college , Spring 20139 / 20 IllustrationUsing Nick Cox sqplotcommand (Stata J.), we illustrate theempirical CDF of log total expenditures, which appears reasonablysymmetric. Note that the 10th, 50th and 90th quantiles are roughly 6,8, and 10 on the log qplot ltotexp, recast(line) ylab(,angle(0)) ///> xlab(0( )1) xline( ) xline( ) xline( )Christopher F Baum (BC / DIW)Quantile regressionBoston college , Spring 201310 / 20 Illustration24681012quantiles of ln(totexp) if totexp > of the dataChristopher F Baum (BC / DIW)Quantile regressionBoston college , Spring 201311 / 20 IllustrationThe median regression, with all covariates butfemalestatisticallysignificant.
8 Qreg ltotexp suppins totchr age female white, nologMedian regression Number of obs = 2955 Raw sum of deviations (about )Min sum of deviations Pseudo R2 = Std. Err. t P>|t| [95% Conf. Interval] .0535936 .1718924 ..0202472 .3545663 ..0041479 .0067335 ..0532006 ..1630984 .1789474 ..341166 F Baum (BC / DIW)Quantile regressionBoston college , Spring 201312 / 20 IllustrationGiven the equivariance property of QR (which depends on the correctspecification of the conditional quantile function), we may calculatemarginal effects in terms of the underlying level variable.
9 Mat b = e(b). qui predict double xb. qui gen double expxb = exp(xb). su expxb, mean. mat b = r(mean)*b. mat li b, ti("Marginal effects ($) on total medical expenditures")b[1,6]: Marginal effects ($) on total medical expendituressuppins totchr age female white _consy1 , for instance, that expenditures increase by $ per year,cet. par., and that one more chronic condition (as captured bytotchr)increases expenditures by $1, ,cet. F Baum (BC / DIW)Quantile regressionBoston college , Spring 201313 / 20 IllustrationWe may also compare OLS and QR estimates of this model at differentquantiles:. eststo clear. eststo, ti("OLS"): qui reg ltotexp suppins totchr age female white, robust(est1 stored).
10 Foreach q in {2. eststo, ti("Q(`q )"): qui qreg ltotexp suppins totchr age female w> hite, q(`q ) nolog3. }(est2 stored)(est3 stored)(est4 stored)(est5 stored)(est6 stored). esttab using , replace nonum nodep mti drop(_cons) ///> ti("Models of log total medical expenditure via OLS and QR")(output written to )Christopher F Baum (BC / DIW)Quantile regressionBoston college , Spring 201314 / 20 IllustrationTable: Models of log total medical expenditure via OLS and QROLSQ( )Q( )Q( )Q( )Q( ) ( )( )( )( )( )( ) ( )( )( )( )( )( ) ( )( )( )( )( )( ) ( )( )( )( )( )( ) ( )( )( )( )( )( )N295529552955295529552955tstatistics in parentheses p< , p< , p< F Baum (BC / DIW)Quantile regressionBoston college , Spring 201315 / 20 IllustrationWe see that the effect of supplementary insurance differs considerably,having a strong effect on expenditures at lower quantiles.