Transcription of Economic and Market Report - acea.be
1 Economic and Market Report EU Automotive Industry Quarter 4 2017 March 2018 ACEA Economic and Market Report : Quarter 4 2017 March 2018 1 CONTENTS EU Economic outlook .. 2 Passenger cars .. 4 Registrations .. 4 World .. 4 The European Union .. 6 Passenger car registrations by fuel type .. 8 Production .. 10 World .. 10 The European Union .. 13 Trade .. 14 Imports .. 15 Exports .. 16 Commercial 17 Registrations in the EU .. 17 New light commercial vehicles (LCV) up to tonnes .. 19 New medium and heavy commercial vehicles (MHCV) over tonnes.
2 20 New medium and heavy buses and coaches (MHBC) over tonnes .. 21 Global production outlook ..22 Trade ..24 Imports .. 25 Exports .. 26 ACEA Economic and Market Report : Quarter 4 2017 March 2018 2 EU Economic OUTLOOK In 2017, the EU economy performed significantly better than expected at the beginning of the year; the result of improved labour Market conditions and stronger domestic demand. The EU s GDP grew by last year, marking the highest growth rate in 10 years. For its Winter Forecast, the European Commission also revised its projections upwards: EU GDP is now estimated to grow by in 2018 and in 2019.
3 Nevertheless, the Brexit negotiations and a global trend towards more protectionist trade policy are still posing a serious threat to this growth. Figure 1: EU GDP growth forecast (in %) SOURCE: WINTER 2018 Economic FORECAST, EUROPEAN COMMISSION ACEA Economic and Market Report : Quarter 4 2017 March 2018 3 Table 1: European Economic Forecast - Winter 2018 EU FORECAST 2017 2018 2019 GDP GROWTH (%, YOY) INFLATION (%, YOY) UNEMPLOYMENT (%) SOURCE: EUROPEAN COMMISSION, DG ECFIN Despite increasing energy prices, inflation in the European Union is forecast to rise only modestly in the next few years.
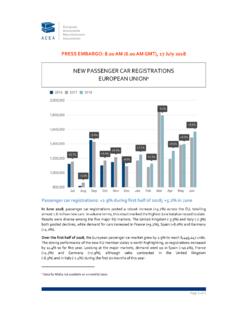
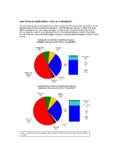
4 According to the Commission s latest estimates, the HICP1 inflation indicator reached in 2017. Looking ahead, inflation is expected to increase slightly to in 2018 and then reduce to in 2019. Thanks to the improving EU labour Market , unemployment is expected to continue to decrease in the years to come, reaching the lowest level since early 2009. The EU unemployment rate is projected to decline from last year to in 2019, as strong domestic demand and moderate wage growth will continue to sustain job creation. 1 Harmonised Index of Consumer Prices ACEA Economic and Market Report : Quarter 4 2017 March 2018 4 PASSENGER CARS REGISTRATIONS WORLD Passenger car sales across the European continent increased by in 2017, totalling 18 million units.
5 After a strong first half of the year, EU registrations slowed during the third and the fourth quarter of 2017, mainly due to the stagnant performance of Western European markets. With million passenger cars sold in 2017, European Union results were higher than the previous year. Representing 19% of the global car Market , the European Union came second, only after China. Throughout 2017, Russian car demand showed signs of recovery, thanks to more stable energy markets, improved oil prices and better Economic conditions resulting in a growth rate of and counting almost million new cars registered in total.
6 Ukraine mirrored this positive trend, showing a substantial increase in car sales (+ ) in 2017. The Turkish Market ended the year with a negative result ( ), although far better than the recorded in the first semester of 2017. In 2017, Japanese car registrations were higher than in the preceding year, with domestic demand improving after the government decided to delay a hike in consumption tax to October 2019. South Korean car sales, however, were slightly down ( ) compared to 2016. In the United States, passenger car volumes went down in 2017.
7 About 14 million cars were sold in total, still representing of the global Market and the United States ranking third after China and the European Union. Brazilian car sales improved noticeably (+ ) in 2017, with consumers having easier access to credit for automotive purchases (lending constraints held back Brazilian vehicle demand in the recent past). As a result, total passenger car demand in South America increased by when compared to 2016, totalling million new cars sold. China finished the year positively, with passenger car demand going up in 2017 and accounting for roughly 30% of global car sales.
8 Looking at other emerging markets, demand for passenger cars in India grew consistently throughout 2017, with sales being higher than the year before. Globally, some 80 million passenger cars were sold in 2017 or more than in 2016. ACEA Economic and Market Report : Quarter 4 2017 March 2018 5 Table 2: World new passenger car registrations 20172 2016 % change 17/16 % share 2017 EUROPE 18,075,171 17,409,995 + EU3 15,137,732 14,641,415 + EFTA 493,955 490,363 + RUSSIA 1,474,576 1,312,950 + TURKEY 729,531 756,938 UKRAINE 79,244 63,492 + OTHERS-EUROPE4 160,133 144,837 + NORTH AMERICA5 16,825,892 17,275,354 of which the US 13,925,270 14,394,986 SOUTH AMERICA 3,520,091 3,114,327 + of which Brazil 1,863,171 1,686,585 + ASIA 37,260,491 35,578,051 + CHINA 24,040,133 23,057,049 + JAPAN 4,386,472 4,123,299 + INDIA 3,321.
9 095 3,020,371 + SOUTH KOREA 1,479,066 1,527,105 OTHERS-ASIA6 4,033,725 3,850,227 + MIDDLE EAST/AFRICA 4,200,340 4,025,478 + WORLD 79,881,985 77,403,205 + SOURCE: IHS MARKIT, ACEA 2 Provisional figures 3 Data for Malta not available 4 Includes Belarus, Bosnia-Herzegovina, Kazakhstan, Macedonia, Serbia and Uzbekistan 5 Based on production type 6 Includes Hong Kong, Taiwan and all the other South Asian countries, excluding India ACEA Economic and Market Report : Quarter 4 2017 March 2018 6 THE EUROPEAN UNION Overall in 2017, EU demand for cars grew (+ ) for the fourth consecutive year, reaching more than 15 million new passenger cars registered for the first time since 2007.
10 Growth was positive in October and November (up in both months) but slowed down in December ( ) due in part to one less working day than December 2016. Among the five big markets, Italy (+ ) and Spain (+ ) recorded the strongest gains, followed by France (+ ) and Germany (+ ). By contrast, last year demand for cars in the United Kingdom declined ( ) for the first time in six years. Noteworthy is the strong performance of the new EU member states, where registrations went up by during the year. Table 3: Top 5 New passenger car registrations in the EU 2017 2016 % change 17/16 GERMANY 3,441,262 3,351,607 + UNITED KINGDOM 2,540,617 2,692,786 FRANCE 2,110,748 2,015,177 + ITALY 1,970,497 1,825,892 + SPAIN 1,234,931 1,147,009 + EU7 15,137,732 14,641,415 + SOURCE: ACEA 7 Data for Malta not available ACEA Economic and Market Report : Quarter 4 2017 March 2018 7 Figure 2: New passenger car registrations in the EU | 12-month trend SOURCE.