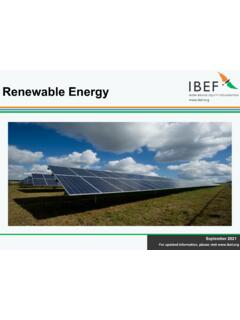
Transcription of Economic impacts of renewable energy
1 renewable energy growth CASE &EXPECTED Economic BENEFITSP resentation to New Mexico Finance Authority Oversight CommitteeSeptember 18, 2020 Rikki SeguinExecutive Director1 PRESENTATION OVERVIEW Interwest Introduction What is Driving Demand? Can New Mexico Projects Win Bids? Economic impacts of renewable Development Increased Business Opportunities Looking Forward2 INTERWEST energy ALLIANCE Regional non-profit trade association representing nation s leading developers and manufacturers of wind, solar, geothermal, and storage technologies, working with environmental NGOs Missionis to make the Intermountain West a leader in deployment of reliable, cost-effective, and diverserenewable energy Mexico, Colorado, Wyoming, Utah, Nevada, Arizona3 INTERWEST energy ALLIANCE4 WHAT IS DRIVING DEMAND?
2 5 COST REDUCTIONS6 Source: Lazard s Levelized Cost of energy Analysis REDUCTIONS7 Source: Lazard s Levelized Cost of energy Analysis Comparison Across TechnologiesIN-STATE POLICY DRIVERS energy Transition Act in 2019 100% carbon-free by 2045 50% RPS by 2040 Goal of 80% renewable by 2040 New Mexico Load is Small NM electricity demand makes up just of total WECC demand PNM System Peak: 7/10/20 = 1,935 MW demand Total renewables online in NM: Wind 1,952 MW Solar 1,068 MW8 Source: Peak load data: PNM 2020-2040 Integrated Resource Plan presentation Aug.
3 25, 2020; Wind data: AWEA; Solar data: SEIAS ource: WECCREGIONAL POLICY DRIVERS80% of energy use in the West is now aligned on decarbonization9 Source: AWEAINCREASED DEMAND FOR RENEWABLES Existing policies in the West require ~9 GW new renewables per yearstarting in 2026 NM has ~3GW installed today By 2050 the total demand in the West is upwards of 150 GW10 Source: energy Strategies, Western Flexibility Assessment (2019)CAN NM PROJECTS WIN BIDS?1112 REGIONAL DRIVERS2016 Net Interchange by Balancing AreaRed = ExportBlue = ImportYES -New Mexico can sell clean energy to these states, but we need to win in competitive steps: Utility issues RFP for clean energy resource Companies bid in from around the region Utility selects the best project (considering cost, resource type, etc.)
4 If bid is not selected, project does not get : WECC State of the Interconnection Digest (Summer 2018)13 Source: NREL: Global Horizonal Solar Irradiance 1998-2016 Source: NREL: US 80m Wind ResourceCONSIDERATIONS: RESOURCE CONSIDERATIONS: RESOURCE14 Capacity Factors Determined for Each WECC State Source: Univ. of Wyoming, Estimating the Impact of State Taxation Policies on the Cost of Wind Development in the West (March 2019)Source: NREL: US 80m Wind ResourceCONSIDERATIONS: RESOURCE 15 Source: Pattern energy Regional Electricity markets benefit from geographic diversity Duck Curve challenges are affecting many markets with high renewable penetration Regional coordination enables least cost, highly efficient pairing of wind and solar resourcesCONSIDERATIONS: COST 16 Source: Univ.
5 Of Wyoming, Estimating the Impact of State Taxation Policies on the Cost of Wind Development in the West (March 2019)MUST REMAIN COMPETITIVE TO WIN BIDS NV energy 2018 RFP Shortlist (9 projects): Approx. difference between highest and lowest bid = $ Black Hills energy 2019 RFP Shortlist Approx. difference between highest and lowest bid = $ : Calculations based on PWRR values published in each utility s RFP response filing with outliers : Univ. of Wyoming, Estimating the Impact of State Taxation Policies on the Cost of Wind Development in the West (March 2019) Economic IMPACTS18 TAXES FROM renewable energy DEVELOPMENT Gross Receipts Tax (direct and induced) on: Construction Operations (example: any purchased services like maintenance) Consumed electricity and other purchased commodities Corporate Income Tax Personal Income Tax on.
6 Payroll Land Lease Payments to Property Owners Operating revenue of vendors providing contract services Property Taxes, if a non-IRB project, or Payment in lieu of taxes (PILT) to each county and school district touched by the project with an IRB1920 CASE STUDY Construction receipts also propped up MTGR in FY20-Q4, posting double-digit growth each month despite the pandemic, largely due to large wind projects in Roosevelt and Torrance Counties, border wall construction in Luna and Do a Ana Counties, and other ongoing projects in Sandoval County.
7 Source: NM Legislative Fiscal Committee General Fund Revenue Tracking Report: Accruals through May 2020 (9/4/20)CASE STUDY Rio Arriba County s budget for the new fiscal year avoids any major cuts to public services or employees hours and pay because of a windfall from a major solar energy But the County made a deal with the Chicago-based energy company Hecate energy around the construction of a solar array on the Jicarilla Apache Nation, and through that agreement, the County will receive $800,000 in two installments, one in August and one in February 2021.
8 Rio Arriba County Avoids Large Budget Cuts with Solar Deal August 13, 2020 Source: Rio Grande Sun (August 2020)REVENUE SHARING ON STATE TRUST LANDS According to the New Mexico State Land Office, there exists about nine million acresof land in the state available for lease to renewable energy companies. Current wind and solar leases bring in ~$1 million per year in lease payments to the state. 9 Active Wind leases = 345 MW 6 Active Solar leases = 221 MW More revenue on the horizon: 19 Wind Lease Applications = 1,835 MW 27 Solar Lease Applications = 2,917 MW22 Source: NM State Land OfficeECONOMIC DEVELOPMENT Landowner Payments: $12 million annually Consistent income that flattens peaks and valleys Keeps local farmers and ranchers on their land consistent income that flattens peaks and valleys Jobs.
9 4,000-5,000 wind and solar jobs in the state Employment numbers highest during construction Additional jobs in Engineering, Tech, Law23 Source: AWEA and SEIAECONOMIC DEVELOPMENT24 Source: US energy + Employment Report, New Mexico (2020)05,00010,000202020252030 MWRPSM arket Demand$0$50$100$150202020252030 Indirect and Induced Tax Revenue$0$5$10$15202020252030$ BillionLocal Economic Benefits(Direct, Indirect, Induced)05001,0001,5002,0002,5003,0003,5 004,000 JobConsutruction JobsPermanent JobsLost Market Growth7,000 MWGrowth Case: Current Policy Drives marketLimited Case.
10 WY-Style taxConstrains marketLost State and Local Tax Revenue$ MillionAnnual Wind and Solar InstallationsState & Local RevenueLocal Economic Impact & Direct renewable Job CreationLost Jobs4,830 Gross Receipts Tax (GRT):$ Million Local Economic Benefits:$ Billion Clean Electricity Tax Revenue:$ Million Employment and Labor:4,830 JobsDiscussion Draft New Mexico renewable energy Development impacts $0$50$100$150202020252030 Indirect and Induced Tax Revenue$0$5$10$15202020252030$ BillionLocal Economic Benefits(Direct, Indirect, Induced)05001,0001,5002,0002,5003,0003,5 004,000 JobConsutruction JobsPermanent JobsLost Local Economic Benefits$ Billion05001,0001,5002,000199920092019 Installed Wind Capacity (MW)Before and After Wyoming "Wind Tax"New MexicoWyomingWyoming Wind Tax Enacted renewable Tax Policy impacts .
