Transcription of Economy at a glance - Canada - RBC
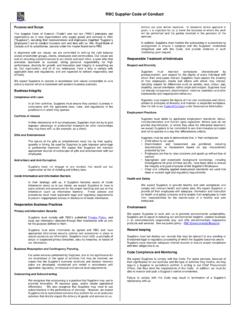
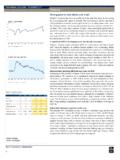
1 CURRENT TRENDS UPDATE Canada Update - June 8, 2018 Canadian GDP up in Q1 but with stronger details Latest available: March Release date: May 31, 2018 The increase in GDP in Q1 was a bit softer-than-expected both by markets and the Bank of Canada who it turns out could have stuck with their call from January rather than hinting at some upside risk in yesterday s policy rate announcement. Notwithstanding the headline miss, though, details were relatively solid. On a monthly basis, weakness was concentrated in Janu-ary with March output rising after a February gain to leave strong-er momentum entering the second quarter. Final domestic demand rose a solid in Q1, led by a big jump in business investment. Residential in-vestment fell , but that was expected given the big drop in home resales earlier this year. Consumer spending rose just on a quarter-over-quarter basis but was still up almost 3% from a year ago.
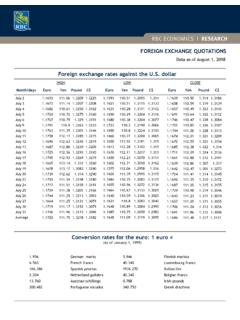
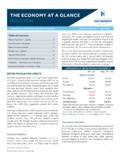
2 Net trade was the main drag on growth but largely because all of that domestic demand growth boosted imports which more than offset an unexpected (albeit still modest) export rise. Overview and highlights The increase in GDP in Q1 was a bit softer-than-expected. May employment unexpectedly fell following a drop in April. Retail sales rose in nominal terms in March marking a third straight monthly gain. Housing starts dropped to 196k in May, down almost 10% from 217k in April and the first sub-200k reading in a year. The improvement in the nominal trade defi-cit to $ billion more-than-retraced a sur-prisingly large deterioration to $ billion in March from $ billion in February. All items inflation edged back down to year-over-year in April after having increased to in March. GDP % change, month-over-month Source: Statistics CanadaEconomy at a glanceLastest monthPrevious monthYear agoReal rate* New starts (000s)* balance ($billlions)* % change from* Levels are shown for the latest period and the same period a year ECONOMICS | RESEARCH 2 Canadian May employment drops though the unemploy-ment rate stays low Latest available: May Release date: June 8, 2018 May employment unexpectedly fell following a drop in April.
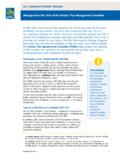
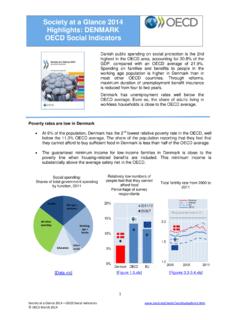
3 To date this year employment has declined an average of 10k per month but is still up 20k per month over the last 12 months. Despite declining employment, the un-employment rate has remained low averaging to date this year and thus below assumed full employment within a range of 6% to 6 1/2%. The annual increase in wages rose to from in April reflecting in part a minimum wage increase in Quebec though tight labour markets was also likely a key fac-tor. Canadian retail sales up in March Latest available: March Release date: May 18, 2018 Retail sales rose in nominal terms in March marking a third straight monthly gain. Volume sales rose to mark a second consecutive monthly increase. The measure was still down at an annualized rate in Q1 but a re-turn to positive growth in the last two months increases the odds that an upward trend resumes in Q2. E-commerce sales, which represents of overall retail sales, were up from a year ago. Canadian housing starts dropped in May Latest available: May Release date: June 8, 2018 Housing starts dropped to 196k in May, down almost 10% from 217k in April and the first sub-200k reading in a year.
4 The often-volatile multiple-unit compo-nent dropped 16% while single-unit starts rose 2%. Regionally, there were big declines in Ontario and Quebec both driven by big declines in multiple-unit starts but increases in the Prairies and British Columbia. Clearly there has been a slowing in home resale activity year-to-date in Canada following the im-plementation of new mortgage stress tests and we expect that will eventually be followed by slower homebuilding as well. The drop in May starts, though, probably reflects normal monthly volatility more than a deterioration in under-lying trends. -90-70-50-30-101030507090201020112012201 320142015201620172018 EmploymentChange in thousands, month-over-month Source: Statistics rate% of labour force Source: Statistics sales% change, month-over-month Source: Statistics Canada1001201401601802002202402602803000 0010203040506070809101112131415161718 Housing startsThousands Source: Canadian Mortgage and Housing Corporation RBC ECONOMICS | RESEARCH The material contained in this report is the property of Royal Bank of Canada and may not be reproduced in any way, in whole or in part, without express authorization of the copyright holder in writing.
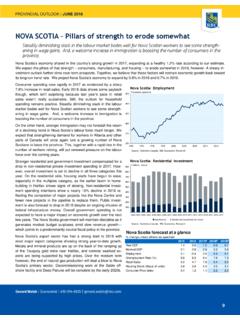
5 The statements and statistics contained herein have been prepared by RBC Economics Research based on information from sources con-sidered to be reliable. We make no representation or warranty, express or implied, as to its accuracy or completeness. This publication is for the information of investors and business persons and does not constitute an offer to sell or a solicitation to buy securities. Registered trademark of Royal Bank of Canada . Royal Bank of Canada . Canada s trade deficit shrunk sharply in April Latest available: April Release date: June 6, 2018 The improvement in the nominal trade deficit to $ billion more-than-retraced a surprisingly large deterioration to $ billion in March from $ billion in February and with relatively solid underlying details. The increase in nominal exports built on a 4% increase in March and was largely the result of higher volume sales rather than prices. The increase in export volumes was led by a 1 1/2% rise in non-energy sales abroad that built on a 2 1/2% March increase.
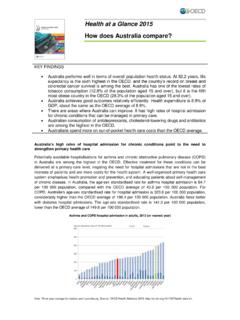
6 The almost 2% drop in import volumes only partially retraced a gain the prior month as motor vehicle and consumer goods purchases eased low-er after big March gains. Equipment import volumes, a key indicator of domes-tic investment spending, also ticked lower but the April level was still above its Q1 average. Canadian inflation treaded water in April Latest available: April Release date: May 18, 2018 All items inflation edged back down to year-over-year in April after having increased to in March. Market expectations, and our own, were for head-line inflation to hold steady at CPI ex food and energy also dipped slightly to from The Bank of Canada s core measures, however, generally increased in April. The trim and median measures both rose to Including CPI-common, the average of the three was after rounding for a third con-secutive month. After accelerating over the last two months, energy inflation slowed on a year-over-year basis as a sharp increase in gasoline prices in April 2017 was not matched this year.
7 We should see the opposite in May, with pump prices having increased recently compared with a decline a year ago. 3003504004505005506006502006200720082009 201020112012201320142015201620172018 Merchandise tradeC$ billions, annualized Source: Statistics CanadaImportsExports-2-10123450001020304 0506070809101112131415161718 Consumer price index% change, year-over-year Source: Statistics Canada