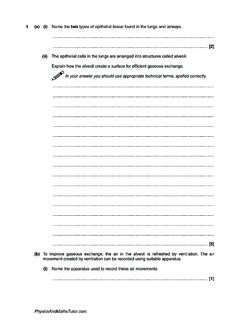
Transcription of Edexcel Geography A-Level Fieldwork - Data Collection ...
1 Edexcel Geography A-Level Fieldwork - Data Collection Techniques Extra Notes Below is anon-exhaustivelist of the different techniques of data collectionyou could use in your investigation. Remember that the techniques you use should provide you with a range of quantitative and qualitative datathat is suitable to analysein your investigation. Try to only choose techniques that will provide you with relevant data for your investigation. General Data Collection Methods Technique Method of collecting data Quantitative or qualitative raw data? Advantages Disadvantages Questionnaire A questionnaire is designed and the investigator asks their chosen audience questions. A sampling technique is chosen prior to the data Collection to ensure valid data. Qualitative (and also quantitative for some questions scores) Opinions can be presented which are not communicated through some quantitative data.
2 New ideas for Fieldwork could arise by talking to people involved in your investigation. Raw data may be hard to condense into an understandable format. Questionnaires can be time consuming. Sampling needs to be considered to ensure the data is representative. Field Sketch Sketch of the area of investigation. Add detailed annotations on features that provide information for your investigation. You could describe processes shown within the field sketch and comment on the noticeable interactions which you find particularly important. Cross-sections are also useful to Qualitative Visually engaging method of presenting ideas and thoughts about an area. Able to choose your focus point whereas in photographs it is more difficult to omit irrelevant areas. Very subjective as it is your opinion on your representation. you may subconsciously omit litter and draw more trees which would make an area appear cleaner than it actually is.
3 Less artistic people may more processes that may not be visible. find it difficult to draw an accurate sketch. Focus group group of people who are told to discuss a concept, perhaps a proposed idea, so that the investigator is aware of the public s attitudes on a subject. Qualitative Focus groups can be catered to show a representative sample of the demographics of the population. , if white people make up 60% of the population, your focus group can be 60% white. hard to organise because focus groups are time consuming, and people may not be willing to take the time to participate. Difficult to condense data down into understandable formats. Interview Usually a 1:1 discussion between investigator and chosen person to provide information on the investigation focus. Qualitative In depth opinions can be collected from a perspective that is integral to your investigation. Some people may feel uncomfortable agreeing to an interview.
4 hard to condense data. Photographs Photographs of areas within the investigation that present relevant aspects of the investigation, litter in a park or destroyed outdoor furniture. Qualitative Photos can represent things more clearly than data, especially environmental aspects. Engaging method of data presentation also (when annotated). Risk of becoming irrelevant filler unless they are analysed and annotated thoroughly during analysis. Survey A survey where a chosen aspect is rated using polar opposite ratings ( from -5 to +5) For example: On a scale of -5 (completely against) to +5 (completely for), what is your opinion of the new multi storey car park in your area? -5 -4 -3 -2 -1 0 1 2 3 4 5 Quantitative Some may find it easier to place their opinion on a scale with contrasting opposites rather than a scale of 1-10, as 0 can act as a good starting point. Easy to condense into a clearer format like a graph.
5 Useful for concepts that have a bipolar aspect. May lead to inaccurate conclusions, especially if sample sizes are small. Surveys about opinions are subjective, so they are hard to analyse. People may still find it difficult to condense their emotions down to a number. Traffic Count Count how many vehicles drive through an predetermined point within an indicated time frame. Directions can also be specified ( into town or out of town). Quantitative Can be presented in multiple ways (in graphs, on maps etc.). Dependent on peak times and days, meaning unless multiple counts are taken it can be inaccurate data. Pedestrian Count Count how many pedestrians walk past an indicated area within an indicated time frame. Note the direction in which they are walking if it is relevant. Quantitative Allows you to assess how busy an area is at different times. Easy to analyse and present in multiple formats. Dependent on peak times and days, meaning unless multiple counts are taken it can be inaccurate data.
6 If the area is very busy it can be hard to count everyone. Use Survey Prior to the survey, choose a relevant area that will be representative of what is being investigated. Walk down your chosen area and note down (tallys are useful) how an area of land is being used (entertainment, public building, commercial, service, outdoor etc.) Quantitative More up to date the digital and physical maps. Easy method of collecting data. May be difficult to add a sufficient level of detail in comparison to already detailed existent mapping services. Can be hard to assess the main use of an area if it is not clear or has multiple uses. Environmental Quality Survey The area of a chosen environment is rated using a scale, for example 1-5. Different aspects of the environment are rated such as noise, building condition, greenery etc. Before conducting, investigation sites should be chosen and your survey should be made specific to your investigation purpose.
7 Quantitative Surveys can be conducted quickly and easily. As the rating system remains the same between investigation areas, it is useful for the comparison of areas. Subjective and based on researcher s opinion. However, as long as the same person conducts all the surveys this is a systematic error which does not affect the overall results. General counts The investigation would be regarding the frequency of something. The frequency could be within a set area. For example, a litter count could be conducted down a chosen street. Frequency could also be within a set time period. For example, the frequency of people that enter a tourism-targeted shop in comparison to a services building in 20 minutes. Quantitative Easy to conduct and analyse. Can be made very specific to your investigation focus.
8 Allows for statistical analysis in later stages. Sampling techniques must be chosen that are relevant and appropriate. Can sometimes be time consuming and open to error. Online Surveys (using social media, Survey Monkey, etc) Publish your survey/ questionnaire online to reach a larger sample, using your own social media platform (Facebook, Instagram, Twitter, etc). Qualitative Larger sample sizes are achieved, depending on your following and privacy settings.. Demographic questions allow for you to sample your data so it is representative. Due to the nature of social media, sampling can only done by volunteering. This means individuals are more likely to be truthful, but can cause data to not be representative of the population.