Transcription of Effectiveness of Hydrofracture Prediction for HDD Design
1 North American Society for Trenchless Technology (NASTT). No-Dig Show 2010. _____. Chicago, Illinois May 2-7, 2010. Paper F-1-01. Effectiveness OF Hydrofracture Prediction . FOR HDD Design . Kimberlie Staheli, , , Christopher G. Price1, Laura Wetter, 1. Staheli Trenchless Consultants, Inc. Seattle, WA (425) 205-4930. ABSTRACT: Mitigation against the risk of Hydrofracture is an essential part of horizontal directional drill (HDD). Design . Previous studies have developed methods to evaluate Hydrofracture risk based on soil and fluid mechanics properties, including cavity expansion theory (Luger and Hergarden, 1988; Bennett and Wallin, 2008; Ariaratnam et al.)
2 , 2003; Staheli et al., 1998). While these studies have been instrumental in the area of Hydrofracture risk analysis, there is currently little comparison of field observed bore pressures and the theoretical predictions generated through these methods. This paper investigates the cavity expansion theory and reports the results of a critical analysis of the factors that impact the calculated limiting pressures for Hydrofracture . Comparisons are then made between the theoretical calculations for maximum bore pressure and actual bore pressure observed on different HDD projects where Hydrofracture occurred, characterizing the Effectiveness of the method, and furthering the accuracy of Hydrofracture Prediction for future HDD designs.
3 1. INTRODUCTION. The risk of Hydrofracture is a consideration on most major horizontal directional drilling (HDD) projects. Within the last 10 years, there has been a concerted effort within the HDD community to quantify limiting down-hole fluid pressures which will cause hydraulic fracturing of the soils, possibly resulting in inadvertent drilling fluid returns at the ground surface. Many have evaluated and used the cavity expansion model (Luger and Hergarden, 1988) to determine the maximum down-hole fluid pressures and to determine appropriate drilling depths beneath critical project elements such as rivers or wetlands.
4 Others have suggested the use of the total stress model to determine maximum drilling pressures. Although the merits of each method have been argued, insufficient data have been collected on HDD projects comparing the actual down-hole fluid pressures at locations of inadvertent fluid returns to the model predictions. This is largely because down-hole pressure measurements have only been collected on HDD utility projects in the recent past. As more data are collected and compared to Prediction models, adjustments can be made to the assumptions that feed each model, resulting in more accurate Hydrofracture predictions.
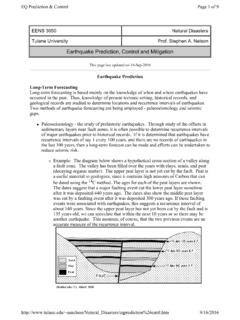
5 In order to understand the comparison between estimated Hydrofracture pressures and actual down-hole pressures that cause inadvertent returns, it is first necessary to examine the equations used to predict limiting drilling fluid pressures and the parameters that have the most effect on the predictions. 2. CAVITY EXPANSION THEORY. Cavity expansion theory was first applied to HDD bores by Luger and Hergarden in 1988. The cavity expansion model and its application to HDD are described in detail in Bennett and Wallin (2008). The model is developed to establish the maximum allowable pressure that can be applied to a given soil without Hydrofracture occuring.
6 This maximum allowable pressure is expressed as the following: Paper F-1-01 - 1. ! "#$ %.. sin + cos .. &'"#$ %. = + 1 + sin + cos + cot + cot 1 .. 89. Where: = Maximum Allowable Mud Pressure 7 <. :;.. = Bore Radius :; . = Radius of the Plastic Zone :; . Variables Dependent on the Soil: = Soil Friction Angle . 89. = cohesion 7 <. :; . 89. = Shear Modulus 7 <. :; . 89. F = Unit weight of soil above the groundwater 7 <. :; I. 89. F = Unit weight of soil below the groundwater = -FL 7 <. :; I. Variables Dependent on Bore Geometry: N = Depth of the Bore below Ground Surface :; L = Height of groundwater over the bore.
7 89. = Groundwater Pressure = S T. :;. 89. = Effective Stress = F N L + F L S T 2 . :; . The value for the radius of the plastic zone (Rpmax) is established by the user. When trying to establish the pressure at which Hydrofracture will occur, the value for the radius of the plastic zone is typically set to the ground surface elevation. During Design , a factor of safety is commonly applied to the radius of the plastic zone to ensure that the plastic zone does not reach the surface. Safety factor values of are usual for sands while values of are applied for clays (Delft, 1997; Bennett and Wallin, 2008).
8 A. Sensitivity Analysis for the Cavity Expansion Model When using the cavity expansion theory, it is important to understand how the independent variables within the equation impact the overall calculation of the limiting pressure. To this end, a sensitivity analysis of each variable was conducted to establish this relative impact. For this analysis, each variable was analyzed over a range of values that would be typical for that particular parameter. Table 1 shows the parameters that were analyzed and the range of values over which the analysis was conducted. Paper F-1-01 - 2.
9 Table 1. Parameters Used in Sensitivity Analysis for Cavity Expansion Theory Parameter Low High Mean N :; 10 20 30 40 50 30. L :; 0 25 50 25.. :; . 89. 7 <. :;. 0 400 800 1200 1600 800. 89. F 7 I <. :;. 90 100 110 120 130 110.. 89. 24 26 28 30 32 28. 7 <. :;. 17,800 468,400 918,900 1,369,500 1,820,000 918,900. :; 10 20 30 40 50 30. The maximum allowable pressure was calculated using the mean value for each of the input parameters resulting in a pressure of 244 psi. Each of the input parameters was systematically varied from low to high while holding all other parameters constant at the mean value.
10 The results of the analysis are presented in the tornado diagram shown in Figure 1. As one would expect, the parameter that has the greatest influence on the maximum allowable pressure is the depth of the bore (hs). Figure 1. Sensitivity Analysis Results on Cavity Expansion Model for Pmax B. The Impact of Shear Modulus on the Cavity Expansion Model What is not immediately obvious from inspection of the maximum pressure equation is the influence of the shear modulus, G. Figure 1 shows that there is a strong positive correlation between the shear modulus and the maximum pressure, that is, as the shear modulus increases, the value of the maximum pressure increases.