Transcription of Effects of Novel Coronavirus (COVID‐19) on Civil Aviation ...
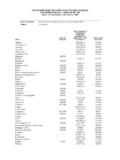
1 Effects of Novel Coronavirus (COVID-19) on Civil Aviation :Economic Impact AnalysisMontr al, Canada10 June 2022 Economic Development Air Transport BureauContents Executive Summary: Economic Impact in Brief Scenario Building Analytical consideration Shapes of Economic Recession and Recovery Indicative Scenarios and Paths Forward2 Estimated 2020/2021 Results and 2022 Outlook: Global Estimated 2020/2021 Results and 2021 Outlook: Regional Breakdown Africa Asia/Pacific Europe Latin America/Caribbean Middle East North AmericaExecutive Summary: Economic Impact in Brief32022 figures and estimates herein are subject to substantial changes, and will be updated with the situation evolving and more information available. Source: icao Air Transport Reporting Form A and A-S plus icao passenger traffic collapses with unprecedented decline in history4 World passenger traffic evolution 1945 20222021 vs.
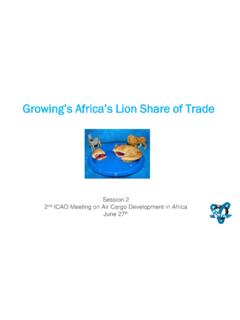
2 2019-49%2020 vs. 2019-60%2022 vs. 2019-21% to -24%Decline in world total passengersThe COVID-19 impact on world scheduled passenger traffic for year 2020 (actual results), compared to 2019 levels: Overall reduction of 50% of seats offered by airlines Overall reduction of 2,703 million passengers (-60%) Approx. USD 372 billion lossof gross passenger operating revenues of airlines5 Year 2020/2021 results:World total passenger trafficThe COVID-19 impact on world scheduled passenger traffic for year 2021 (preliminary estimates), compared to 2019 levels: Overall reduction of 40% of seats offered by airlines Overall reduction of 2,201 million passengers (-49%) Approx. USD 324 billion lossof gross passenger operating revenues of airlines050100150200250300350400450 Passenger Numbers (million)InternationalDomestic2019 totalModerate recovery in domestic travel while international travel remained stagnantSource: icao estimatesMonthly passenger numbers in 2020-21-22 vs.
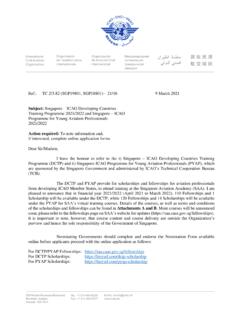
3 20196 Regional difference in resilience and speed of recovery Comparison of total seat capacity by region(7-day average, YoY compared to 2019) Source: icao ADS-B7-100%-80%-60%-40%-20%0%20%40%Afric aAsia/PacificEuropeLatin America/CaribbeanMiddle EastNorth America-100%-80%-60%-40%-20%0%Jan 20 Mar 20 May 20 Jul 20 Sep 20 Nov 20 Jan 21 Mar 21 May 21 Jul 21 Sep 21 Nov 21 Jan 22 Mar 22 May 22 Jul 22 Sep 22 Nov 22 Scenarios for passenger number ActualScenari o 1 Scenari o 1aScenari o 2 Scenari o 2aReference-100%-80%-60%-40%-20%0%Jan 20 Mar 20 May 20 Jul 20 Sep 20 Nov 20 Jan 21 Mar 21 May 21 Jul 21 Sep 21 Nov 21 Jan 22 Mar 22 May 22 Jul 22 Sep 22 Nov 22 Scenarios for passenger seat capacity ActualScenari o 1 Scenari o 1aScenari o 2 Scenari o 2aReference8 Year 2022 outlook.
4 Due to uncertainty, consider 4 different pathsThe actual impacts will depend on duration and magnitude of the outbreak and containment measures, the degree of consumer confidence for air travel, and economic conditions, etc. -80%-70%-60%-50%-40%-30%-20%-10%0%10%Jan 21 Feb 21 Mar 21 Apr 21 May 21 Jun 21 Jul 21 Aug 21 Sep 21 Oct 21 Nov 21 Dec 21 Jan 22 Feb 22 Mar 22 Apr 22 May 22 Jun 22 Jul 22 Aug 22 Sep 22 Oct 22 Nov 22 Dec 22 Outlook 2022 (compared to 2019 levels)Seat capacity (Low)Seat capacity (High)Passenger number (Low)Passenger number (High)9 Domestic passenger traffic (2022, vs. 2019) Overall reduction of 12% to 14% of seats offered by airlines Overall reduction of 464 to 537 million passengers (-18% to -20%) Approx. USD 37 to 43 billion lossof gross operating revenues of airlinesInternational passenger traffic (2022, vs.)
5 2019) Overall reduction of 20% to 25% of seats offered by airlines Overall reduction of 457 to 544 million passengers (-25% to -29%) Approx. USD 96 to 112 billion lossof gross operating revenues of airlinesYear 2022 outlook: international and domestic passenger trafficThe COVID-19 impact on world scheduled passenger traffic for year 2022 (estimated results), compared to 2019 levels: Overall reduction of 15% to 18% of seats offered by airlines Overall reduction of 921 to 1,079 million passengers (-21% to -24%) Approx. USD 133 to 155 billion lossof gross passenger operating revenues of airlinesScenario Building10 This section will be updated in due course. Scope of analysis11 Analysis focuses on simultaneous supply shock and drop in demand in a near-term, monthly profile from January 2020 to December 2022 in terms of scheduled passenger traffic globally Taking into account the heterogeneity, distinction is made.
6 Between international and domestic by month (seasonality) by six (6) geographical region and/or 50 route groups used in icao s long-term traffic forecasts (LTF) Analysis is based on forward-looking scenarios, which will be continuously adjusted and updated Analytical Consideration12 Geographical disparity of international -domestic passenger traffic mix Difference in market size among regions Potential difference in resilience and speed of recovery Outbreak timing that impacts when traffic would bottom out Gap between what is scheduled and actual operationsSource: icao long-term traffic forecasts, ADS-B and estimatesInternational share of passenger traffic decreased in all regions in 2019-2020-2021 Share of international -domestic passenger traffic by region (2019-2020-2021, based on from/to State)13 Source: icao long-term traffic forecasts, ADS-B and estimatesEurope accounted for over half of the world international traffic in 2021 Number of international passengers by region (2019-2020-2021, based on from/to State)Share2021 vs.
7 201914 Source: icao long-term traffic forecasts, ADS-B and estimatesNorth America overtook China with over 30% share of world domestic passengers in 2021 Number of domestic passengers by Route Group (2019-2020-2021)Share 2021 vs. 201915 Asia/Pacific and North America have experienced 20% to 25% less decline in domestic passenger traffic than international 16 Domestic passenger traffic often exhibits more resilience than internationalDomestic seat capacity reduction (7-day average, YoY compared to 2019) international seat capacity reduction (7-day average, YoY compared to 2019) Source: icao ADS-B operation data-100%-80%-60%-40%-20%0%20%AfricaAsia /PacificEuropeLatin America/CaribbeanMiddle EastNorth America-100%-80%-60%-40%-20%0%20%40%60%A fricaAsia/PacificEuropeLatin America/CaribbeanMiddle EastNorth AmericaDomestic passenger traffic has been recovering ahead of international Source.
8 icao ADS-B operation data17 China domestic passenger traffic experienced significant volatility during the recovery course due to the renewed outbreaksThe outbreak timing impacts when domestic traffic bottoms out in each regionSource: icao ADS-B operation dataCapacity evolution of two largest domestic markets China and United States since January 202018 Source: icao long-term traffic forecasts, ADS-B and estimatesFor international passenger traffic, share of Intra-Region traffic further decreased in 2021 Share of Intra-Region and Inter-Region passenger traffic by region(2019-2020-2021, based on from/to State, share of international traffic)19 Source: OAGA large gap exists between scheduled and actual operationsSubstantial variations between airlines announced capacity and actual capacityInternational schedulesDomestic schedules20 Shapes of Economic Recession and Recovery21 Informal classification to describe different types of recessions: V-shaped: normal shape for recession, a brief period of sharp economic decline followed by quick/smooth recovery U-shaped:prolonged contraction and muted recovery to trend line growth L-shaped (depression): long-term downturn in economic activity, steep drop followed by a flat line with possibility of not returning to trend line growth W-shaped: a double-dip recession, down up down up pattern before full recovery Nike swoosh -shaped*.
9 Bounce back sharply but blunt quickly (* Brookings Institution/WEF) What recession shape can be assumedgiven uncertainties surrounding the outlook? 22 Source: IMF Word Economic Outlook (January2021)World s GDP Projections (by IMF) How long will the pandemic last and what will be the severity levels? How deep and how long will the global recession be? How long will lockdowns and travel restrictions continue? How fast will consumer confidence in air travel be restored? Will there be a structural shift in industry and consumers behaviors? How long can the air transport industry withstand the financial adversity? Previous outbreaks/pandemics had a V-shaped impact on air transport in Asia/Pacific Source: IATA COVID-19 Updated Impact Assessment (dated 24 March 2020) The impact of COVID-19 has already surpassed the 2003 SARS outbreak which had resulted in reduction of annual RPKs by 8% and USD 6 billion revenues for Asia/Pacific airlines.
10 The 6-month recovery path of SARS might not apply to today s and global financial crisis had a U/L-shaped impact on air transport in United States Source: A4A Tracking the Impacts of COVID-19 (updated on 7 December 2021)24 Scenarios and Paths Forward25As overall severity and duration of the COVID-19 pandemic are still uncertain, four (4) different recovery paths under two (2) indicative scenarios are developed: Baseline: counterfactual scenario, in which the COVID-19 pandemic does not occur, that is, originally-plannedorbusiness as usual Scenario 1:two (2) different paths (similar to Nike swoosh-and W-shaped) Scenario 2:two (2) different paths (similar to U-and L-shaped) Reference: information only, based on latest airline schedules (similar to V-shaped) Notwithstanding the elevated uncertainty surrounding the outlook, a scenario analysis could help gauge potential economic implications of the pandemic Scenarios are not forecasts of what is most likely to happen.