Transcription of EL NIÑO/SOUTHERN OSCILLATION (ENSO) …
1 EL NI O/SOUTHERN OSCILLATION (ENSO) DIAGNOSTIC. DISCUSSION. issued by climate prediction center /NCEP/NWS. and the International Research Institute for climate and Society 8 March 2018. ENSO Alert System Status: La Ni a Advisory Synopsis: A transition from La Ni a to ENSO-neutral is most likely (~55% chance) during the March-May season, with neutral conditions likely to continue into the second half of the year. During February 2018, La Ni a weakened, but was still reflected by below-average sea surface temperatures (SSTs) in the east-central equatorial Pacific Ocean (Fig. 1). The latest weekly index values were C and C in the Ni and Ni o-3 regions, respectively, and were near zero in the surrounding Ni and Ni o1+2 regions (Fig.)
2 2). While negative anomalies were maintained near the surface, the sub-surface temperature anomalies (averaged across 180 -100 W) warmed to near zero (Fig. 3). This warming was due to the eastward propagation of above-average temperatures along the thermocline in association with a downwelling equatorial oceanic Kelvin wave (Fig. 4). The atmospheric anomalies typical of La Ni a weakened considerably across the tropical Pacific. Convection was suppressed near Indonesia and was only weakly enhanced over the far western Pacific (Fig. 5). Also, low-level wind anomalies were westerly over the western and central Pacific, while upper-level winds remained anomalously westerly over the eastern Pacific.
3 Overall, the ocean and atmosphere system suggests La Ni a is weakening. Most models in the IRI/CPC plume predict La Ni a will decay and return to ENSO-neutral during the Northern Hemisphere spring 2018 (Fig. 6). The forecast consensus similarly favors a transition during the spring, with a continuation of ENSO-neutral conditions through the summer. In summary, a transition from La Ni a to ENSO-neutral is most likely (~55% chance) during the March-May season, with neutral conditions likely to continue into the second half of the year (click CPC/IRI consensus forecast for the chance of each outcome for each 3-month period). This discussion is a consolidated effort of the National Oceanic and Atmospheric Administration (NOAA), NOAA's National Weather Service, and their funded institutions.
4 Oceanic and atmospheric conditions are updated weekly on the climate prediction center web site (El Ni o/La Ni a Current Conditions and Expert Discussions). Forecasts are also updated monthly in the Forecast Forum of CPC's climate Diagnostics Bulletin. Additional perspectives and analysis are also available in an ENSO blog. The next ENSO Diagnostics Discussion is scheduled for 12 April 2018. To receive an e-mail notification when the monthly ENSO Diagnostic Discussions are released, please send an e-mail message to: climate prediction center National Centers for Environmental prediction NOAA/National Weather Service College Park, MD 20740.
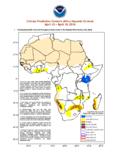
5 Figure 1. Average sea surface temperature (SST) anomalies ( C) for the week centered on 28. February 2018. Anomalies are computed with respect to the 1981-2010 base period weekly means. Figure 2. Time series of area-averaged sea surface temperature (SST) anomalies ( C) in the Ni o regions [Ni o-1+2 (0 -10 S, 90 W-80 W), Ni o-3 (5 N-5 S, 150 W-90 W), Ni (5 N- 5 S, 170 W-120 W), Ni o-4 (5 N-5 S , 150 W-160 E]. SST anomalies are departures from the 1981-2010 base period weekly means. Figure 3. Area-averaged upper-ocean heat content anomaly ( C) in the equatorial Pacific (5 N- 5 S, 180 -100 W). The heat content anomaly is computed as the departure from the 1981- 2010 base period pentad means.)
6 Figure 4. Depth-longitude section of equatorial Pacific upper-ocean (0-300m) temperature anomalies ( C) centered on the pentad of 27 February 2018. Anomalies are departures from the 1981-2010 base period pentad means. Figure 5. Average outgoing longwave radiation (OLR) anomalies (W/m2) for the period 2 27. February 2018. OLR anomalies are computed as departures from the 1981-2010 base period pentad means. Figure 6. Forecasts of sea surface temperature (SST) anomalies for the Ni o region (5 N- 5 S, 120 W-170 W). Figure updated 19 February 2018.