Transcription of Emission Factors for Greenhouse Gas Inventories
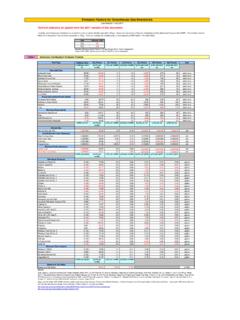
1 Table 1 Stationary Combustion Emission FactorsLast Modified: 19 November 2015 Red text indicates an update from the 2014 version of this , Greenhouse gas emissions are reported in units of carbon dioxide equivalent (CO2e). Gases are converted to CO2e by multiplying by their global warming potential (GWP). The Emission Factors listed in this document have not been converted to CO2e. To do so, multiply the emissions by the corresponding GWP listed in the table below. Source: Intergovernmental Panel on Climate Change (IPCC), Fourth Assessment Report (AR4), 2007. See the source note to Table 9 for f urther explanation. Emission Factors for Greenhouse Gas InventoriesSource:Solid, gaseous, liquid, and biomass fuels: Federal Register (2009) EPA; 40 CFR Parts 86, 87, 89 et al; Mandatory Reporting of Greenhouse Gases; Final Rule, 30 Oct09, 261 pp. Tables C-1 and C-2 at FR pp. 56409-56410. Revised Emission Factors for selected fuels: Federal Register (2010) EPA; 40 CFR Part 98; Mandatory Reporting of Greenhouse Gases; Final Rule, 17 Dec10, 81 pp.
2 With Amendments from Memo: Table of Final 2013 Revisions to the Greenhouse Gas Reporting Rule (PDF) to 40 CFR part 98, subparts C and AA: Table C 1 to Subpart C Default CO2 Emission Factors and High Heat Values for Various Types of Fuel, Table C 2 to Subpart C Default CH4 and N2O Emission Factors for Various Types of Fuel, and Table AA 1 to Subpart AA of Part 98 Kraft Pulping Liquor emissions Factors for Biomass-Based CO2, CH4, and GWPCH4 25N2O 298 Fuel TypeHeating ValueCO2 FactorCH4 FactorN2O FactorCO2 FactorCH4 FactorN2O FactorUnitmmBtu per short tonkg CO2 per mmBtug CH4 per mmBtug N2O per mmBtukg CO2 per short tong CH4 per short tong N2O per short tonCoal and CokeAnthracite Coal 11 2,602 276 40short tonsBituminous Coal 11 2,325 274 40short tonsSub-bituminous Coal 11 1,676 190 28short tonsLignite Coal 11 1,389 156 23short tonsMixed (Commercial Sector) 11 2,016 235 34short tonsMixed (Electric Power Sector)
3 11 1,885 217 32short tonsMixed (Industrial Coking) 11 2,468 289 42short tonsMixed (Industrial Sector) 11 2,116 246 36short tonsCoal Coke 11 2,819 273 40short tonsFossil Fuel-derived Fuels (Solid)Municipal Solid Waste 32 902 318 42short tonsPetroleum Coke (Solid) 32 3,072 960 126short tonsPlastics 32 2,850 1,216 160short tonsTires 32 2,407 896 118short tonsBiomass Fuels (Solid)Agricultural Byproducts 32 975 264 35short tonsPeat 32 895 256 34short tonsSolid Byproducts 32 1,096 332 44short tonsWood and Wood Residuals 1,640 126 63short tonsmmBtu per scfkg CO2 per mmBtug CH4 per mmBtug N2O per mmBtukg CO2 per scfg CH4 per scfg N2O per scfNatural GasNatural Gas Fuels (Gaseous)Blast Furnace Gas Oven Gas Gas Gas Fuels (Gaseous)
4 Landfill Gas Biomass Gases per gallonkg CO2 per mmBtug CH4 per mmBtug N2O per mmBtukg CO2 per gallon g CH4 per gallon g N2O per gallonPetroleum ProductsAsphalt and Road Oil Gasoline Oil Fuel Oil No. 1 Fuel Oil No. 2 Fuel Oil No. 4 Gas Oils Jet Fuel Petroleum Gases (LPG) Gasoline (<401 deg F) Gasoline Oil (>401 deg F) Plus Feedstocks Coke Fuel Oil No.
5 5 Fuel Oil No. 6 Naphtha Gas Oils Oil Fuels (Liquid)Biodiesel (100%) (100%) Animal Fat Oil Biomass Fuels (Kraft Pulping Liquor, by Wood Furnish) North American Softwood American Hardwood text indicates an update from the 2014 version of this Factors for Greenhouse Gas InventoriesLast Modified: 19 November 2015 Page 2 of 5 Table 2 Mobile Combustion CO2 Emission FactorsSource:Federal Register (2009) EPA; 40 CFR Parts 86, 87, 89 et al; Mandatory Reporting of Greenhouse Gases; Final Rule, 30 Oct09, 261 pp. Tables C-1 and C-2. Table of Final 2013 Revisions to the Greenhouse Gas Reporting Rule, September 24, sourced from: GREET Software, GREET1_2013 Model, Argonne National Laboratory.
6 The GREET model provides carbon content and fuel density, which are used to develop the CO2 Emission 3 Mobile Combustion CH4 and N2O Emission Factors for On-Road Gasoline VehiclesFuel Typekg CO2 per unitUnitAviation Gasoline (100%) Natural Gas (CNG) Fuel (100%) Jet Fuel Natural Gas (LNG) Petroleum Gases (LPG) Gasoline Fuel Oil TypeYearCH4 Factor (g / mile)N2O Factor (g / mile)Gasoline Passenger Cars1973-74 Light-Duty Trucks1973-74 (Vans, Pickup Trucks, SUVs)1975 Heavy-Duty Vehicles<1981 MotorcyclesSource: EPA (2015) Inventory of Greenhouse Gas emissions and Sinks: 1990-2013.
7 All values are calculated from Tables A-102 through text indicates an update from the 2014 version of this Factors for Greenhouse Gas InventoriesLast Modified: 19 November 2015 Page 3 of 5 Table 4 Mobile Combustion CH4 and N2O Emission Factors for On-Road Diesel and Alternative Fuel VehiclesSource: EPA (2015) Inventory of Greenhouse Gas emissions and Sinks: 1990-2013. All values are calculated from Tables A-105 through 5 Mobile Combustion CH4 and N2O Emission Factors for Non-Road VehiclesSource: EPA (2015) Inventory of Greenhouse Gas emissions and Sinks: 1990-2013. All values are calculated from Table : LPG non-road vehicles assumed equal to other gasoline sources. Biodiesel vehicles assumed equal to other diesel 6 Electricity Emission FactorsSource: EPA eGRID2012, October 2015 Note: Total output Emission Factors can be used as default Factors for estimating GHG emissions from electricity use when developing a carbon footprint or emissions inventory. Annual non-baseload output Emission Factors should not be used for those purposes, but can be used to estimate GHG emissions reductions from reductions in electricity TypeVehicle YearCH4 Factor (g / mile)N2O Factor (g / mile)1960-1982 Medium- and Heavy-Duty Vehicles1960-present Light-Duty Vehicles Medium- and Heavy-Duty Vehicles Buses Light-Duty Vehicles Medium- and Heavy-Duty Vehicles Medium- and Heavy-Duty Vehicles Light-Duty Vehicles Medium- and Heavy-Duty Vehicles Buses Light-Duty Vehicles Medium- and Heavy-Duty Vehicles Buses Passenger CarsDiesel Light-Duty TrucksVehicle TypeCH4 Factor (g / gallon) N2O Factor (g / gallon) Residual Fuel Oil Ships and Boats Ships and Boats Ships and Boats Locomotives Agricultural Equip.
8 Agricultural Equip. Construction Equip. Construction Equip. Fuel Aircraft Gasoline Aircraft Gasoline Non-Road Vehicles Diesel Non-Road Vehicles Non-Road Vehicles Non-Road Vehicles SubregionCO2 FactorCH4 FactorN2O FactorCO2 FactorCH4 FactorN2O Factor(lb CO2 /MWh)(lb CH4 /MWh)(lb N2O /MWh)(lb CO2/MWh)(lb CH4/MWh)(lb N2O/MWh)AKGD (ASCC Alaska Grid) 1, 1, (ASCC Miscellaneous) 1, (WECC Southwest) 1, 1, (WECC California) 1, (ERCOT All) 1, 1, (FRCC All) 1, 1, (HICC Miscellaneous) 1, 1, (HICC Oahu) 1, 1, (MRO East) 1, 1, (MRO West) 1, 1, (NPCC New England) 1, (WECC Northwest) 1, (NPCC NYC/Westchester) 1, (NPCC Long Island) 1, 1, (NPCC Upstate NY) 1, (RFC East) 1, (RFC Michigan)
9 1, 1, (RFC West) 1, 1, (WECC Rockies) 1, 1, (SPP North) 1, 1, (SPP South) 1, 2, (SERC Mississippi Valley) 1, 1, (SERC Midwest) 1, 1, (SERC South) 1, 1, (SERC Tennessee Valley) 1, 1, (SERC Virginia/Carolina) 1, Average 1, 1, Output Emission FactorsNon-Baseload Emission FactorsRed text indicates an update from the 2014 version of this Factors for Greenhouse Gas InventoriesLast Modified: 19 November 2015 Page 4 of 5 Table 7 Steam and Heat Emission FactorsTable 8 Business Travel Emission FactorsTable 9 Product Transport Emission FactorsSource: CO2, CH4, and N2O emissions data for on-road vehicles are from Table 2-13 of the Inventory of Greenhouse Gas emissions and Sinks: 1990 2013. Vehicle-miles and passenger-miles data for on-road vehicles are from Table VM-1 of the Federal Highway Administration Highway Statistics consumption data and passenger-miles data for rail are from Tables to and to of the Transportation Energy Data Book: Edition 33.
10 Fuel consumption was converted to emissions by using fuel and electricity Emission Factors presented in the tables above. Air Travel Factors from 2015 Guidelines to Defra / DECC's GHG Conversion Factors for Company Reporting. Version July : A Passenger car: includes passenger cars, minivans, SUVs, and small pickup trucks (vehicles with wheelbase less than 121 inches). B Light-duty truck: includes full-size pickup trucks, full-size vans, and extended-length SUVs (vehicles with wheelbase greater than 121 inches). C Intercity rail: long-distance rail between major cities, such as AmtrakD Commuter rail: rail service between a central city and adjacent suburbs (also called regional rail or suburban rail)E Transit rail: rail typically within an urban center, such as subways, elevated railways, metropolitan railways (metro), streetcars, trolley cars, and tramways. F These Factors represent a methdology change from previous Factors , based on improved data. Source: CO2, CH4, and N2O emissions data for on-road vehicles are from Table 2-13 of the Greenhouse Gas emissions and Sinks: 1990 2013.