Transcription of Employer Costs for Employee Compensation - December 2021
1 For release 10:00 (EST) Friday, December 15, 2017 USDL-17-1646 Technical information: (202) 691-6199 Media contact: (202) 691-5902 Employer Costs FOR Employee Compensation SEPTEMBER 2017 Employer Costs for Employee Compensation averaged $35. 64 per hour worked in September 2017, the Bureau of Labor Statistics reported today. Wages and salaries averaged $ per hour worked and accounted for percent of these Costs , while benefit Costs averaged $ and accounted for the remaining percent. Total Employer Compensation Costs for private industry workers averaged $ per hour worked in September 2017. Total Employer Compensation Costs for state and local government workers averaged $ per hour worked in September 2017.
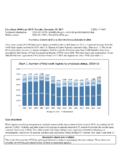
2 Highlights of Employer Compensation Costs per hour worked for state and local government workers, September 2017: State and local government employers spent an average of $ per hour worked for employeetotal Compensation . Employer Costs for wages and salaries averaged $ per hour and accounted for percentof Compensation Costs . (See table 3.) Employer Costs for benefits averaged $ per hour worked and accounted for the percent. (See table 3.) Employer Costs by occupational group ranged from $ per hour worked for sales and officeworkers to $ per hour worked for management, professional, and related workers. ThisChart 1. Employer Costs for retirement and savings benefits, selected occupational groups, state and local government workers, September 2017 Chart 2.
3 Percent of total Compensation , selected benefits, state and local government workers, September 2017 Cost per hour worked Percent of total Compensation $ $ $ $ $ $ ,professional,and relatedSales andofficeService0%2%4%6%8%10%12%14%Healt hinsuranceDefinedbenefitDefinedcontribut ion- 2 -major occupational group includes teachers, whose Compensation Costs averaged $ per hour worked. Service workers averaged $ (See table 4.) Employers spent $ per hour worked, or percent of total Compensation for retirement and savings benefits. (See table 3.) Employer Costs for retirement and savings for management, professional, and related workers averaged $ per hour worked.
4 Employer Costs for retirement and savings for sales and office workers averaged $ , and service workers averaged $ (See table 4.) Included in retirement and savings benefits were Employer Costs for defined benefit plans, which averaged $ per hour ( percent of total Compensation ), and defined contribution plans, which averaged 39 cents ( percent). (See chart 2 and table 3.) Insurance benefit Costs averaged $ per hour, or percent of total Compensation . The largest component of insurance Costs was health insurance, which averaged $ , or percent of total Compensation . (See chart 2 and table 3.) Employer Costs for paid leave include vacation, holiday, sick leave, and personal leave.
5 The average cost for paid leave was $ per hour worked for state and local government employees. (See table 3.) Employer Costs for legally required benefits, including Social Security, Medicare, unemployment insurance (both state and federal), and workers Compensation , averaged $ per hour worked. (See table 3.) Benefit Costs in private industry Private industry Employer Costs for paid leave averaged $ per hour worked or percent of total Compensation , supplemental pay averaged $ or percent, insurance benefits averaged $ or percent, retirement and savings Costs averaged $ or percent, and legally required benefits averaged $ per hour worked or percent.
6 (See table A and table 5.) Table A. Relative importance of Employer Costs for Employee Compensation , September 2017 Compensation component Civilian workers1 Private industry State and local government Wages and salaries Benefits Paid leave Supplemental pay Insurance Health Retirement and savings Defined benefit Defined contribution Legally required 1 Includes workers in the private nonfarm economy except those in private households, and workers in the public sector, except the federal government.
7 _____ Employer Costs for Employee Compensation for December 2017 is scheduled to be released on Tuesday, March 20, 2018, at 10:00 (EDT).- 3 - TECHNICAL NOTE Employer Costs for Employee Compensation (ECEC) measures the average cost to employers for wages and salaries and benefits per Employee hour worked. The ECEC includes the civilian economy, which includes data from both private industry and state and local government. Excluded from private industry are the self-employed and farm and private household workers. Federal government workers are excluded from the public sector. The private industry series and the state and local government series provide data for the two sectors separately.
8 Sample size Data for the September 2017 reference period were collected from a probability sample of approximately 27,500 occupational observations selected from a sample of about 6,700 private industry establishments and approximately 8,100 occupational observations selected from a sample of about 1,400 state and local government establishments that provided data at the initial interview. ECEC benchmarking by establishment size and industry For information on benchmarking by industry, see The Weighting Process Used in the Employer Costs for Employee Compensation Series for the National Compensation Survey, at Comparing private and public sector data Compensation cost levels in state and local government should not be directly compared with cost levels in private industry.
9 Differences between these sectors stem from factors such as variation in work activities and occupational structures. Manufacturing and sales, for example, make up a large part of private industry work activities but are rare in state and local government. Professional and administrative support occupations (including teachers) account for two-thirds of the state and local government workforce, compared with one-half of private industry. ECEC quarterly publication focus ECEC news releases are published quarterly, providing civilian, private industry, and state and local government cost per hour estimates as well as additional detail on a specific Compensation cost topic of interest.
10 This quarter s release focuses on retirement benefit Costs in state and local government. Topics of news releases for the upcoming reference periods are as follows: December 2017 Supplemental pay benefits in private industry March 2018 Compensation Costs in selected metropolitan areas and health benefit Costs in private industry ECEC detailed information and measures For detailed information on Employer Costs for Employee Compensation , see Chapter 8, National Compensation Measures, of the BLS Handbook of Methods at The National Compensation Survey also produces data on the percentage of state and local government workers with access to and participating in Employer -sponsored benefit plans, including health care as well as retirement and savings plans.
