Transcription of Employer-Reported Workplace Injuries and Illnesses – 2017
1 For release 10:00 (EST) Thursday, November 9, 2017 USDL-17-1482 Technical information: (202) 691-6170 Media contact: (202) 691-5902 Employer-Reported Workplace Injuries AND Illnesses 2016 There were approximately million nonfatal Workplace Injuries and Illnesses reported by private industry employers in 2016, which occurred at a rate of cases per 100 full-time equivalent (FTE) workers, the Bureau of Labor Statistics reported today. (See and ) Private industry employers reported nearly 48,500 fewer nonfatal injury and illness cases in 2016 compared to a year earlier, according to estimates from the Survey of Occupational Injuries and Illnesses (SOII). Chart 1. Nonfatal occupational injury and illness incidence rates by case type, private industry, 2003-16 The 2016 rate of total recordable cases (TRC) fell cases per 100 FTE workers to continue a pattern of declines that, apart from 2012, occurred annually since 2004.
2 (See chart 1.) The rate of other recordable cases (ORC) declined by cases, while rates for remaining case types days away from work, job transfer or restriction (DART); days away from work (DAFW); and days of job transfer or restriction only (DJTR) were unchanged from a year earlier. The rate for DJTR cases has remained at cases per 100 FTE workers since 2011. Nearly one-third of nonfatal occupational Injuries and Illnesses were of a more serious nature and resulted in days away from work. (Cases with days away from work)DART (Cases with days away from work, job transfer, or restriction)DJTR (Cases with days of job transfer or restriction only)ORC (Other recordable cases)TRC (Total recordable cases)Incidence rates per 100 full-time equivalentworkersChanges To News Release Format Beginning with the 2016 reference year, the SOII will issue a single release of national data .
3 This release includes industry counts and rates, along with case circumstances and worker characteristics for cases requiring days away from work. In previous years, these data were released separately. 2 Chart 2. Nonfatal occupational injury and illness incidence rates by selected private industry sector, 2003-16 Four private industry sectors construction, manufacturing, wholesale trade, and retail trade experienced statistically significant declines in the TRC rate of occupational Injuries and Illnesses in 2016. (See chart 2.) Finance and insurance was the only industry sector in which the TRC rate of Injuries and Illnesses increased in 2016; though, the relatively low number of cases reported in this sector yielded the lowest rate among all private industry sectors ( cases per 100 FTE workers).
4 The TRC rate of work-related Injuries and Illnesses was unchanged among the 14 remaining private industry sectors in 2016. Cases resulting in days away from work There were 892,270 occupational Injuries and Illnesses in 2016 that result ed in days away from work in private industry, essentially unchanged from the number reported for 2015. The private industry incidence rate for DAFW cases was per 10,000 full-time equivalent (FTE) workers in 2016. The median days away from work a key measure of the severity of cases was 8 days in 2016, unchanged from 2015. (See , , and ) Of the four private industry sectors whose rates of total recordable cases declined in 2016 construction, manufacturing, wholesale trade, and retail trade only retail trade (122,390) and manufacturing (118,050) had more than 100,000 DAFW cases.
5 Of these two industry sectors, only and insuranceRetail tradeWholesale tradeIncidencerates per 100 full-time equivalent workersData and analysis in this section highlight case circumstances and worker characteristics for example, worker occupation, event or exposure, and the nature of the injury or illness, among others that are available for nonfatal Injuries and Illnesses that resulted in days away from work. Note: Counts and incidence rates of case circumstances and worker characteristics for cases with days away from work (DAFW) estimates are presented at a different precision level than for other case types. data users are cautioned to account for different levels of precision when analyzing estimates presented in this release. In this section, it is implied that statements refer to DAFW cases unless otherwise noted.
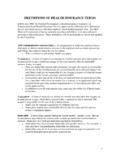
6 3 manufacturing had a decrease in both the count and incidence rate for DAFW cases in 2016. (See and ) In manufacturing, the number of DAFW cases fell by 4,560 (4 percent) to 118,050 in 2016. (See chart 3.) This resulted in an incidence rate of cases per 10,000 FTE workers in 2016, down from cases in 2015. (See ) Workers in manufacturing who sustained occupational Injuries and Illnesses resulting in days away from work in 2016 required a median of 9 days to return to work, unchanged from 2015. (See ) Injuries and Illnesses to production workers accounted for 64 percent (75,070 cases) of total DAFW cases in manufacturing in 2016, a decrease of 3,510 cases from 2015. (See ) Injuries and Illnesses to transportation and material moving workers accounted for 18 percent (21,100 cases) of the total DAFW cases in manufacturing, which was a decrease of 950 cases from 2015.
7 (See ) Chart 3. Selected changes in days-away-from-work cases from 2015 to 2016 in manufacturing by event or exposure In manufacturing, 19 percent (22,040) of the DAFW cases were the result of falls, slips, or trips in 2016, a decline of 1,470 cases from 2015 levels. (See chart 3 and ) This resulted in an incidence rate of cases per 10,000 FTE workers in 2016, down from a rate of cases in 2015. (See ) Other leading events or exposures in manufacturing in 2016 included contact with object or equipment ( cases per 10,000 FTE workers) and overexertion and bodily reaction ( cases). Both rates were essentially unchanged from 2015. (See ) Chart 4. Nonfatal occupational injury and illness incidence rates for days-away-from-work cases in manufacturing by leading nature of injury or illness, private industry, 2012-16 -5,000-4,000-3,000-2,000-1,0000 Violence and other Injuries by persons or animalFires and explosionsExposure to harmful substances or enviromentsFalls, slips, tripsTotalChange in number of cases(Total 2016 DAFW cases = 118,050)010203040 Sprains, strains, tearsCuts, lacerations, puncturesSoreness, painFractures20122013201420152016 Incidencerates per 10,000 full-time equivalent workers 4 In manufacturing, the rate of sprains, strains, or tears ( cases per 10,000 FTE workers); cuts, lacerations, or punctures ( cases); soreness or pain ( cases).
8 And fractures ( cases) were among the leading types of injury or illness cases resulting in days away from work in 2016. (See chart 4 and ) Sprains, strains, or tears accounted for 30 percent (35,110) of the DAFW cases in manufacturing, a decrease of 2,480 cases from 2015. (See ) These cases occurred at a rate of cases per 10,000 FTE workers in 2016, down from cases in 2015. (See chart 4 and ) Cuts, lacerations, or punctures accounted for 13 percent (14,960) of the DAFW cases in manufacturing, a decrease of 720 cases from 2015. This contributed to a decrease in the incidence rate in 2016 for cuts, lacerations, or punctures to cases per 10,000 FTE workers, down from cases in 2015. (See chart 4 and and ) Additional Information This news release is the first in a series of two releases from BLS covering occupational safety and health statistics for the 2016 calendar year.
9 The SOII presents estimates of counts and incidence rates of Employer-Reported nonfatal Workplace Injuries and Illnesses by industry and type of case, as well as more detailed estimates of case circumstances and worker characteristics for cases that resulted in days away from work. A second release in December will provide data from the Census of Fatal Occupational Injuries (CFOI) of all fatal work Injuries occurring in the during the calendar year. The CFOI uses diverse state, federal, and independent data sources to identify, verify, and describe fatal work Injuries to ensure that counts are as complete and accurate as possible. BLS has generated estimates of nonfatal occupational Injuries and Illnesses for many industries as defined in the 2012 North American Industry Classification System (NAICS) manual.
10 Tables including cross-tabulations for various case circumstances and worker characteristics are also available. (See ) A complete listing of SOII estimates is not available in this release. See for additional information on nonfatal injury and illness industry estimates or see for additional background information regarding case circumstances and worker characteristics among SOII estimates. Additional data from the SOII are available on the BLS website at or from BLS staff at (202) 691-6170 or by email at Information in this release will be made available to sensory impaired individuals upon request. Voice phone: (202) 691-5200; Federal Relay Service: (800) 877-8339. All statements of comparison made in this news release were found to be statistically significant at the 95 percent confidence level.