Transcription of Employer-Reported Workplace Injuries and Illnesses – 2019
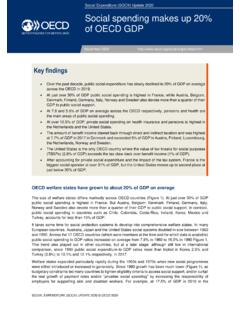
1 Chart 1. Incidence rate of total recordable cases, private industry, 2010-19 Chart 2. Incidence rate of days away from work cases and job transfer or restriction only cases, private industry, 2010-19 For release 10:00 (ET) Wednesday, November 4, 2020 USDL-20-2030 Technical information: (202) 691-6170 Media contact: (202) 691-5902 Employer-Reported Workplace Injuries AND Illnesses 2019 Private industry employers reported million nonfatal Workplace Injuries and Illnesses in 2019, unchanged from 2018, the Bureau of Labor Statistics reported today. These estimates are from the Survey of occupational Injuries and Illnesses (SOII). In 2019, the incidence rate of total recordable cases (TRC) in private industry was cases per 100 full-time equivalent (FTE) workers, which was the rate reported in 2018 and 2017. (See chart 1.)
2 The incidence rate of days away from work (DAFW) cases was cases per 100 FTE workers and the incidence rate of days of job transfer and restriction only (DJTR) cases was cases per 100 FTE workers, which were the rates reported in 2018. (See chart 2.) There were 888,220 nonfatal Injuries and Illnesses that caused a private industry worker to miss at least one day of work in 2019, essentially unchanged from 2018. Changes in Industry and Occupation classification Structure Information in this release incorporates revisions to both the North American Industry classification System (NAICS) and the Standard occupational classification codes (SOC). comparison of SOII estimates for 2019 to prior years should be done with caution due to these changes. More information on NAICS can be found at More information on SOC can be found at 2011 2012 2013 2014 2015 2016 2017 2018 2019 Incidence rate per 100 FTE 2011 2012 2013 2014 2015 2016 2017 2018 2019 Incidence rate per 100 FTE workersDays Away From WorkDays of Job Transfer or Restriction Only2 Industry Manufacturing accounted for percent of all private industry nonfatal Injuries and Illnesses in 2019 and was the only private industry sector where the TRC rate had a statistically significant change over the year.
3 The rate decreased from in 2018 to cases per 100 FTE workers in 2019. (See table 1.) The number of nonfatal cases was 421,400, essentially unchanged from 2018. (See table 2.) Injuries and Illnesses to manufacturing workers resulted in 32,470 DAFW cases of sprains, strains, or tears ( percent); 16,790 cases of soreness or pain ( percent); and 15,380 cases involving cuts, lacerations, or punctures ( percent). (See table 3.) TRC rates decreased for several manufacturing industry groups. The rate for motor vehicle body and trailer manufacturing decreased from cases in 2018 to cases per 100 FTE workers in 2019. (See chart 3.) Spring and wire product manufacturing was the only industry group with an increase in its TRC rate in 2019. The TRC rate increased from cases in 2018 to cases per 100 FTE workers in 2019. Chart 3. Incidence rates for total recordable cases in selected private manufacturing industries, 2018-19 Nonfatal occupational injury and illness estimates by industry and case type are available at and Occupation Ten occupations accounted for percent of all private industry cases involving days away from work in both 2018 and 2019.
4 (See table 4.) Of these, laborers and freight, stock, and material movers, hand had the highest number of DAFW cases with 64,160; followed by heavy and tractor-trailer truck drivers with 47,990. The incidence rates involving DAFW for these 10 occupations increased over the year. (See chart 4.) appliancemanufacturingClay product andrefractory manufacturingMachine shops; turnedproduct; and screw, nut,and bolt manufacturingAnimal slaughtering andprocessingMotor vehicle body andtrailer manufacturingIncidence rates per 100 FTE workers201820193 The median number of days away from work in private industry in 2019 was 8 days, the same as 2018. Heavy and tractor-trailer truck drivers had a median number of DAFW of 19 days, down from 23 days in 2018. Light truck drivers had a median of 20 days, an increase of 4 days from 2018. The median days for maintenance and repair workers, general; and laborers and freight, stock, and material movers, hand increased to 12 days in 2019 from 10 days in 2018.
5 Chart 4. Incidence rates of cases involving days away from work for selected occupations in private industry, 2018- 19 Additional Highlights Within private industry, the rate of total recordable cases of nonfatal Injuries and Illnesses in theretail trade sector was essentially unchanged from a year ago. In 2018, the rate increased to from cases per 100 FTE workers in 2017. (See table 1.) Private industry workers age 65 years or over had a median of 16 days away from work due toinjuries and Illnesses in 2019, compared to 8 days for all private industry workers. Private industry workers with sprains, strains, or tears resulting in days away from work visitedmedical treatment facilities at a rate of cases per 10,000 FTE workers in 2019, down from in 2018. Medical treatment facilities include emergency room visits and/or in-patienthospitalization.
6 Within private industry, the DAFW incidence rate for men decreased from in 2018 to in 2019 and the rate for women decreased from in 2018 to cases per 10,000 FTEworkers in salespersonsRegistered nursesJanitors and cleaners, except maids and housekeeping cleanersStockers and order fillersMaintenance and repair workers, generalConstruction laborersLight truck driversLaborers and freight, stock and material movers, handHeavy and tractor-trailer truck driversNursing assistantsIncidence rates per 10,000 FTE workers201820194 Coronavirus (COVID-19) Pandemic Impact on the Survey of occupational Injuries and Illnesses Estimates in this news release are for reference year 2019. No changes in estimation procedures or outputs were necessary due to COVID-19. Additional information is available at Additional Information This news release is the first of two releases from BLS covering occupational safety and health statistics for the 2019 calendar year.
7 The SOII presents estimates of counts and incidence rates of Employer-Reported nonfatal Workplace Injuries and Illnesses by industry and type of case, as well as detailed estimates of case circumstances and worker characteristics for cases that resulted in days away from work. A second release on December 16, 2020, will provide results from the Census of Fatal occupational Injuries (CFOI) of all fatal work Injuries occurring in the during the calendar year. Data and analysis in this release highlight case circumstances and worker characteristics for nonfatal Injuries and Illnesses that resulted in days away from work. Incidence rates for days away from work cases are published per 10,000 full-time employees. Incidence rates per 10,000 workers can be converted to rates per 100 workers by moving the decimal point left, two places, and rounding the resulting rate to the nearest tenth.
8 Data users are cautioned to account for different levels of precision when analyzing estimates presented in this release. BLS has generated estimates of nonfatal occupational Injuries and Illnesses for many industries as defined in the 2017 North American Industry classification System (NAICS) manual. Tables including cross-tabulations for various case circumstances and worker characteristics are available at For additional information on nonfatal injury and illness estimates, see The SOII bases definitions for emergency room and hospital visits on occupational Safety and Health Administration (OSHA) Regulations. (See for additional information.) All statements of comparison made in this news release are statistically significant at the 95 percent confidence level. Additional background and methodological information regarding the BLS occupational safety and health statistics program is located in the BLS Handbook of Methods at Additional data from the SOII are available on the BLS website at , from BLS staff at (202) 691-6170, or by email at Information in this release is available to sensoryimpaired individuals upon request.
9 Voice phone: (202) 691-5200; Federal Relay Service: (800) 1. Incidence rates of nonfatal occupational Injuries and Illnesses by selected industry and case types, private industry, 2018-192018201920182019 Private industry(4) , forestry, fishing and hunting(4) , quarrying, and oil and gas extraction(5) and warehousing (6) and estate and rental and , scientific, and technical of companies and and support and waste management and remediation Educational care and social , entertainment, and and food services (except public administration) :(3) Days-away-from-work cases include those that result in days away from work with or without job transfer or restriction.(4) Excludes farms with fewer than 11 employees.(6) Data for employers in rail transportation are provided to BLS by the Federal Railroad Administration, Department of : Dash indicates data do not meet publication guidelines, data may be too small to be : Bureau of Labor Statistics, Department of Labor, Survey of occupational Injuries and Illnesses , in cooperation with participating state agencies.
10 (1) Data are coded using the North American Industry classification System (NAICS). For more information on the version of NAICS used in this year, see our Handbook of Methods concepts page: recordable cases (2)Cases with days away from work(2),(3)(2) The incidence rates represent the number of Injuries and Illnesses per 100 full-time workers and were calculated as:(N/EH) x 200,000, where N = number of Injuries and Illnesses ; EH = total hours worked by all employees during the calendar year; 200,000 = base for 100 equivalent full-time workers (working 40 hours per week, 50 weeks per year).(5) Data for Mining (Sector 21 in the North American Industry classification System) include establishments not governed by the Mine Safety and Health Administration (MSHA) rules and reporting, such as those in oil and gas extraction and related support activities.