Transcription of Employment Cost Index - March 2022 - Bureau of Labor ...
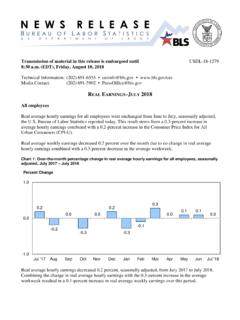
1 Transmission of material in this release is embargoed untilUSDL-18-0637 8:30 (EDT) Friday, April 27, 2018 Technical information: (202) 691-6199 Media contact: (202) 691-5902 Employment cost Index March 2018 Compensation costs for civilian workers increased percent, seasonally adjusted, for the 3-month period ending in March 2018, the Bureau of Labor Statistics reported today. Wages and salaries (which make up about 70 percent of compensation costs) increased percent, and benefits (which make up the remaining 30 percent of compensation) increased percent. (See chart 1 and tables A, 1, 2, and 3.) Civilian Workers Compensation costs for civilian workers increased percent for the 12-month period ending in March 2018 compared with a compensation costs increase of percent in March 2017.
2 Wages and salaries increased percent for the 12-month period ending in March 2018 and increased percent for the 12-month period ending in March 2017. Benefit costs increased percent for the 12-month period ending in March 2018. In March 2017, the increase was percent. (See chart 2and tables A, 4, 8, and 12.)Private Industry Workers Compensation costs for private industry workers increased percent over the year, a larger increase than the increase in March 2017. Wages and salaries increased percent for the current 12-month period and increased percent in March 2017. The cost of benefits rose percent for the 12-month period ending in March 2018 and increased percent in March 2017. (See charts 3 and 4 and tables A, 5, 9, and 12.) Chart 2. Twelve-month percent change, not seasonally adjusted, civilian workers, wages and salaries and benefits Chart 1.
3 Three-month percent change, seasonally adjusted, civilian workers, compensation Wages and salaries Benefits- 2 - Chart 5. Twelve-month percent change, not seasonally adjusted, state and local government, wages and salaries and benefits Employer costs for health benefits increased percent for the 12-month period ending in March 2018. (For further information, see chart 3 and ) Among occupational groups, compensation cost increases for private industry workers for the 12-month period ending in March 2018 ranged from percent for both management, professional, and related occupations and natural resources, construction, and maintenance occupations to percent for production, transportation, and material moving occupations. (See table 5.) Among industry supersectors, compensation cost increases for private industry workers for the 12-month period ending in March 2018 ranged from percent for education and health services to percent for financial activities.
4 (See table 5.) State and Local Government Compensation costs for state and local government workers increased percent for the 12-month period ending in March 2018. In March 2017, the increase was percent. Wages and salaries increased percent for the 12-month period ending in March 2018, compared with percent a year ago. Benefit costs increased percent for the 12-month period ending in March 2018. The prior year s increase was percent. (See chart 5 and tables A, 7, 11, and 12.) Chart 4. Twelve-month percent change, not seasonally adjusted, private industry, wages and salaries and benefits Chart 3. Twelve-month percent change, not seasonally adjusted, private industry, benefits and health benefits 02468200820102012201420162018 Health benefitsBenefits024682008201020122014201 62018 Wages and salaries Benefits02468200820102012201420162018 Wages and salaries BenefitsSeasonal Factors and Updated Layout The 2018 seasonal factors for directly adjusted series and revised seasonally adjusted series for the past five years were released today, see With the July 31, 2018 release, the file format of tables 1-13 will be modified to improve usablity.
5 The updated layout is available for review at - 3 - Table A. Major series of the Employment cost Index (Percent change) Category 3-month, seasonally adjusted 12-month, not seasonally adjusted Dec. 2017 Mar. 2018 Mar. 2017 Jun. 2017 Sep. 2017 Dec. 2017 Mar. 2018 CIVILIAN WORKERS1 Compensation2 Wages and salaries Benefits PRIVATE INDUSTRY Compensation2 Wages and salaries Benefits STATE AND LOCAL GOVERNMENT Compensation2 Wages and salaries Benefits 1 Includes private industry and state and local government. 2 Includes wages and salaries and benefits. The Employment cost Index for June 2018 is scheduled for release on Tuesday, July 31, 2018, at 8:30 (EDT).
6 Information in this release will be made available to sensory impaired individuals upon request Voice phone: (202) 691-5200; Federal Relay Service: (800) 877-8339. BLS news releases, including the Employment cost Index , are available through an email subscription service at For videos and information graphics explaining the Employment cost Index and how it is used, see - 4 - TECHNICAL NOTE The Employment cost Index (ECI) measures the change in the cost of Labor , free from the influence of Employment shifts among occupations and industries. For information on survey concepts, coverage, methods, nonresponse adjustment, and imputation see National Compensation Measures Handbook of Methods at Sample size Data for the March 2018 reference period were collected from a probability sample of approximately 27,300 occupational observations selected from a sample of about 6,600 private industry establishments and approximately 8,000 occupational observations selected from a sample of about 1,400 state and local government establishments that provided data at the initial interview.
7 Standard errors To assist users in ascertaining the reliability of Employment cost Index (ECI) series, standard errors of all current quarter estimates except seasonally adjusted series are also available, see Standard errors provide users a measure of the precision of an estimate to ensure that it is within an acceptable range for their intended purpose. Historical listings Historical listings are available at #tables. The continuous occupational and industry series listing uses the Standard Industrial Classification Manual and Occupational Classification System series from 1975 through 2005 and the North American Industry Classification System and Standard Occupational Classification from 2006 to the present. It provides the official series deemed continuous after the change in classification systems. For more information on the criteria used in defining continuous series, see the article published in the Monthly Labor Review at Employer Costs for Employee Compensation data The costs per hour worked of compensation components are published as part of the Employer Costs for Employee Compensation news release (ECEC).
8 The ECEC release dates are available at Historical ECEC data are available in summary documents at #tables. Since the ECEC is calculated with current Employment weights rather than the fixed weights used in computing the ECI, year-to-year changes in the cost levels usually differ from those in the ECI. Fixed Employment Weights For additional information on the use of fixed Employment weights in computing the ECI, see - 5 - Table 1. Employment cost Index for total compensation,1 by occupational group and industry (Seasonally adjusted)- 5 - Table 1. Employment cost Index for total compensation,1 by occupational group and industry (Seasonally adjusted)Occupational group and industryIndexes ( = 100)Percent changes for 3 months ended Civilian workersAll Industry Goods-producing Service-providing industries Education and health Educational Elementary and secondary Junior colleges, colleges, universities, and professional Health care and social Nursing and residential care Public Private industry workersAll Occupational group Management, professional, and Management, business, and Professional and Sales and Sales and Office and administrative Natural resources, construction, and Construction.
9 Extraction, farming, fishing, and Installation, maintenance, and Production, transportation, and material Transportation and material Service Industry Goods-producing Aircraft Service-providing industries Trade, transportation, and Wholesale trade Retail Transportation and Financial Finance and Credit intermediation and related Insurance carriers and related See footnotes at end of 6 - Table 1. Employment cost Index for total compensation,1 by occupational group and industry Continued (Seasonally adjusted)- 6 - Table 1.
10 Employment cost Index for total compensation,1 by occupational group and industry Continued (Seasonally adjusted)Occupational group and industryIndexes ( = 100)Percent changes for 3 months ended Industry Real estate and rental and Professional and business Professional, scientific, and technical Administrative and support and waste management and remediation Education and health Educational Junior colleges, colleges, universities, and professional Health care and social Nursing and residential care Leisure and Accommodation and food Other services, except public State and local government workersAll Industry Education and health Educational Elementary and secondary Health care and social Public 1 Includes wages, salaries, and employer costs for employee benefits.