Transcription of Employment Outlook 2018 - OECD
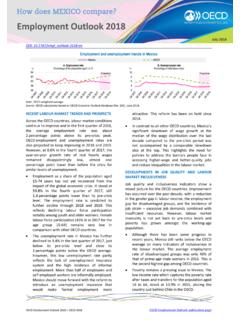
1 OECD Employment Outlook 2018 OECD 2018 OECD Employment Outlook publication page How does CANADA compare? Employment Outlook 2018 July 2018 DOI: market developments in Canada Note: OECD weighted average (based on 29 OECD countries in Panel B, not including Chile, Iceland, Korea, Mexico, New Zealand and Turkey). Source: OECD calculations based on OECD Economic Outlook Database (No. 103), June 2018, and quarterly national LABOUR MARKET TRENDS AND PROSPECTS Across the OECD countries, labour market conditions continue to improve and in the first quarter of 2018, the average Employment rate was about 2 percentage points above its pre-crisis peak. OECD Employment and unemployment rates are also projected to keep improving in 2018 and 2019. However, at in the fourth quarter of 2017, the year-on-year growth rate of real hourly wages remained disappointingly low, almost one percentage point lower than before the crisis for similar levels of unemployment.
2 The labour market situation in Canada has gradually improved since the fourth quarter of 2016, and Employment rates are projected to remain stable. Employment as a share of those aged 15 to 74 is expected to remain around 66%, slightly below the pre-crisis peak of achieved in the fourth quarter of 2007. Despite improvements in the labour market situation in other OECD countries, the Employment rate in Canada remains above the OECD average. Canadian real wage growth has been stagnant since the crisis. From the beginning of 2009 to the end of 2017, year-on-year real hourly wage growth has averaged just However it has recently shown signs of a recovery, growing by year-on-year in the fourth quarter of 2017, above the OECD average. DEVELOPMENTS IN JOB QUALITY AND LABOUR MARKET INCLUSIVENESS Job quality and inclusiveness indicators show a mixed picture for the OECD countries.
3 Improvement has occurred over the past decade, with a reduction in the gender gap in labour income, the Employment gap for disadvantaged groups, and the incidence of job strain excessive job demands combined with insufficient resources. However, labour market insecurity is not yet back to pre-crisis levels and poverty has grown amongst the working-age population. Canada performs at or above the OECD average in measures of job quality and labour market inclusiveness. In particular, Canadian workers can expect to lose only of their net income if they lose their job, compared with an OECD average of However Canada has a relatively high rate of low income households, with of the working age population (aged 18 to 64) living in households with disposable income less than 50% of the median.
4 Low-paying jobs and low productivity growth have kept wage growth sluggish. 56586062646668%CanadaOECD-2-10123%B. Real hourly wageYear-on-year percentage change, trended seriesA. Employment ratePercentage of the population aged 15-74 ProjectionsContact: Duncan MacDonald (+33 1 45 24 82 24; or Mark Pearson (+33 1 45 24 92 69; Directorate for Employment , Labour and Social Affairs. OECD Employment Outlook publication page OECD Employment Outlook 2018 OECD 2018 Job quality and labour market inclusiveness: key indicators for Canada in 2016-2017 Note: An upward (downward ) pointing arrow for an indicator means that higher (lower) values reflect better performance. Earnings quality: Gross hourly earnings in USD adjusted for inequality by giving more weight to the lower end of the earnings distribution. Labour market insecurity: Expected percentage net income loss upon job loss computed taking into account the probability of becoming unemployed and the expected duration of unemployment.))
5 Low income rate: Share of working-age persons living with less than 50% of median equivalised household disposable income. Gender labour income gap: Difference between per capita annual earnings of men and women (% of per capita earnings of men). Employment gap for disadvantaged groups: Average difference in the prime-age men's Employment rate and the rates for five disadvantaged groups (mothers with children, youth who are not in full-time education or training, workers aged 55-64, non-natives, and persons with disabilities; % of the prime-age men's rate). Source and definitions: OECD calculations using data for 2017 or latest year available from various sources. See OECD Employment Outlook 2018, Ch. 1 EARLY PROVISION OF Employment SERVICES AFTER JOB LOSS CAN SPEED UP RE- Employment Every year, between 1% and 7% of the workforce of OECD countries faces job loss due to economic reasons.
6 Displaced workers find new jobs much more rapidly in some countries than in others, suggesting a key role for well-targeted policy. In particular, early Employment support intervention during the notice period before the layoff occurs can greatly reduce the length of the unemployment spell. In Canada, less than half of workers who faced job loss for economic reasons found a new job with one year. This re- Employment rate is similar to the United States, but lags Australia and New Zealand. Canada treats severance payments as compensation. This means Employment insurance eligibility is typically delayed, resulting in a delay in registration with the public Employment service, and delaying activation measures such as counselling and job search aid.
7 A promising model is Ontario s Rapid Re- Employment and Training Service. It provides an immediate response to large-scale layoffs by connecting individuals with Provincial services. A key component of the process is the development of a local or regional multi-disciplinary team to provide timely, focused and integrated services to affected workers. UNEMPLOYMENT BENEFITS REACH ONLY A MINORITY OF JOBSEEKERS Unemployment benefits are one of the principal instruments for linking jobless people to Employment support programmes. But in most countries, fewer than one in three jobseekers receive unemployment benefits. Policy initiatives during the early stages of the global financial crisis made benefits more accessible and extended coverage.
8 But, overall, coverage has frequently continued the downward trend seen before the crisis. Unemployment benefit coverage in Canada is below the OECD average, and decreased significantly between 2007 and 2014. This is as a result of a relatively low maximum potential duration of benefits and a more than doubling of long-term unemployment over the period. Mexico: USDD enmark: USDOECD: USDC anada: USDE arnings quality ( )Greece: : : : market insecurity ( )Greece: 16%Czech Rep.: : : rate ( )QualityKorea: 61%Finland: : : : : : : labour income gap ( )Employmentgap for disadvantaged groups( )InclusivenessBottom performerTop performer