Transcription of Employment Situation: Ohio and U.S. (Seasonally Adjusted)
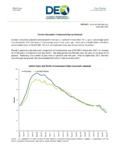
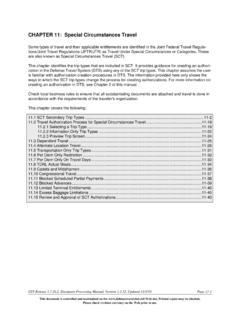
1 OFFICE OF WORKFORCE DEVELOPMENTBUREAU OF labor MARKET INFORMATIONC ivilian labor ForceOhio s unemployment rate was percent in September 2018, unchanged from August. The number of unemployed in ohio in September was 266,000, down 2,000 from 268,000 in August. The number of unemployed has decreased by 21,000 in the past 12 months from 287,000. The September unemployment rate for ohio decreased from percent in September unemployment rate for September was percent, down from percent in August, and down from percent in September and Unemployment Rates (Seasonally Adjusted) Payroll SurveyOver-the-Month Change: ohio s nonagricultural wage and salary Employment increased 4,300 over the month, from a revised 5,634,600 in August to 5,638,900 in September, according to the latest business establishment survey conducted by the Department of labor (Bureau of labor Statistics) in cooperation with in goods-producing industries, at 939,500, increased 2,600 as gains in manufacturing (+3,400) and mining and logging (+100) surpassed losses in construction (-900).
2 The private service-providing sector, at 3,908,300, added 3,900 jobs. Employment gains in other services (+3,400), professional and business services (+1,300), and trade, transportation, and utilities (+500) exceeded losses in leisure and hospitality (-1,000), educational and health services (-200), and financial activities (-100). Information did not change over the month. Government Employment , at 791,100, decreased 2,200. Losses in local (-1,400) and state (-1,000) government exceeded gains in federal government (+200).Over-the-Year Change: From September 2017 to September 2018, nonagricultural wage and salary Employment grew 104,600. Employment in goods-producing industries increased 22,700. Manufacturing added 16,100 jobs in durable goods (+14,000) and nondurable goods (+2,100).
3 Construction added 5,400 jobs and mining and logging added 1,200 in the private service-providing sector increased 74,600 as gains in trade, transportation, and utilities (+18,400), leisure and hospitality (+18,100), educational and health services (+16,500), other services (+11,400), professional and business services (+5,800), and financial activities (+4,700) outweighed losses in information (-300).Government Employment increased 7,300 with gains in state (+4,100), local (+2,900), and federal (+300) Nonfarm Employment Over-the-Month Change (Seasonally Adjusted) In This IssueEmployment situation : ohio and civilian labor force and Nonagricultural Employment Estimates Seasonally labor force Estimates Seasonally Nonagricultural Employment Seasonally Nonagricultural Wage and Salary Employment Not Seasonally Nonagricultural Employment Not Seasonally of Metropolitan Statistical Statistical and Earnings of All Employees Not and Earnings of Production and Nonsupervisory Employees Not Seasonally Unemployment Insurance Activities Not Seasonally of Businesses by Mar-12 Sep-12 Mar-13 Sep-13 Mar-14 Sep-14 Mar-15 Sep-15 Mar-16 Sep-16 Mar-17 Sep-17 Mar-18 ,00005,00010,00015,00020,00025,000 Aug-17 Sep-17 Oct-17 Nov-17 Dec-17 Jan-18 Feb-18 Mar-18 Apr-18 May-18 Jun-18 Jul-18 Aug-18 Sep-18 Employment situation .
4 ohio and (Seasonally Adjusted) labor Market reviewSepteMber 20182 ohio labor MARKET REVIEWSEPTEMBER 2018 OFFICE OF WORKFORCE DEVELOPMENT BUREAU OF labor MARKET INFORMATIONOhioCivilian labor force and NonagriculturalWage and Salary Employment EstimatesSeasonally AdjustedaaData for latest month are preliminary, although other months are subject to revision. Subtotals may not add to totals due to rounding. Unemployment rates are computed from unrounded figures. All data exclude military personnel. bData are Local Area Unemployment Statistics estimates based on place of residence. cFrom the Current Employment Statistics Survey, a monthly survey of approximately 26,900 employers conducted by the Bureau of labor Statistics. Estimates represent nonagricultural wage and salary jobs by place of adjusted nonfarm Employment data for the ohio Metropolitan Statistical Areas may be accessed at the Bureau of labor Statistics website at labor ForcebTotal5, 5, 5, , 5, 5, Rate (%).
5 SurveycTotal Nonagricultural5, 5, 5, Private4, 4, 4, (Private) and (Private)3, 3, 3, , Transportation, and Utilities1, 1, 1, , Warehousing, and and Estate and Rental and and Business and Technical of Companies and , Support, and Waste and Health Care and Social and , Entertainment, and and Food (thousands)
6 Employment (thousands)Change PercentChange From Last MonthFrom Last YearFrom Last MonthFrom Last Year3 ohio labor MARKET REVIEWSEPTEMBER 2018 OFFICE OF WORKFORCE DEVELOPMENT BUREAU OF labor MARKET INFORMATIONOhio Historical civilian labor force EstimatesSeasonally Adjusted20085, 5, 20095, 5, 20105, 5, 20115, 5, 20125, 5, 20135, 5, 20145, 5, 20155, 5, 20165, 5, 20175, 5, 2017 August5, 5, September5, 5, October5, 5, November5, 5, December5, 5, 2018 January5, 5, February5, 5, March5, 5, April5, 5, May5, 5, June5, 5, July5, 5, August5, 5, September5, 5, labor force (thousands)
7 Unemployment RatesTotalEmployed UnemployedOhio2 0 0 08 010 012 0 Jan-08 May-08 Sep-08 Jan-0 May-0 Sep-0 Jan-10 May-10 Sep-10 Jan-11 May-11 Sep-11 Jan-12 May-12 Sep-12 Jan-1 May-1 Sep-1 Jan-1 May-1 Sep-1 Jan-15 May-15 Sep-15 Jan-1 May-1 Sep-1 Jan-17 May-17 Sep-17 Jan-18 May-18 Sep-183ercent5eceVVLon8 S OKLoOhio and Unemployment Rates (Seasonally Adjusted) Recessionary periods as defined by the National Bureau of Economic Research (NBER).4 ohio labor MARKET REVIEWSEPTEMBER 2018 OFFICE OF WORKFORCE DEVELOPMENT BUREAU OF labor MARKET INFORMATION2017 August5.
8 , , , Service-Providing Employment (thousands)Government Employment (thousands)TotalTrade, Transport., and ActivitiesProf. and Business ServicesEducational and Health ServicesLeisure and HospitalityOther ServicesTotalFederal State LocalGrand TotalTotalMining and LoggingConst. Goods-Producing Employment (thousands)OhioHistorical Nonagricultural Wage and Salary Employment Seasonally AdjustedPercent Change in ohio Nonfarm Employment by Month January 2000 - September 2018 (Seasonally Adjusted) Recessionary periods as defined by the National Bureau of Economic Research (NBER). Note: In June 2015 the seasonal model for state government Employment was updated to account for improved data collection.
9 To preserve the continuity of the time series, the updated seasonal factors were applied back to October 2014. The series affected are state government, total government, and total nonfarm Employment . If you have any questions about the updates, please email ChangeRecessionGoods-ProducingPrivate Service-ProvidingGovernment5 ohio labor MARKET REVIEWSEPTEMBER 2018 OFFICE OF WORKFORCE DEVELOPMENT BUREAU OF labor MARKET INFORMATIONOhio NonagriculturalWage and Salary EmploymentaNot Seasonally AdjustedFrom From From FromSepAugSepLast Last Last Last2018b2018c2017cMonth YearMonth YearTotal Nonagricultural5, 5, 5, Private4, 4, 4, (Private) , Logging, and and of Building and Civil Engineering Trade Mineral Product Metal Iron and Steel Mills and Ferroalloy Metal Product Shops and Threaded Machinery and Electronic Product Equipment, Appliance, and Component Mfg.
10 Appliance Equipment Vehicle Vehicle Parts Product and Parts and Related Product and Related Support and Rubber Products Product Product (Private)3, 3, 3, , Transportation, and Utilities1, 1, 1, Wholesalers, Durable and Commercial , Equipment, and Wholesalers, Nondurable continued on next page -EmploymentPercentChange (thousands)Change(thousands)