Transcription of Envelope and Cepstrum Analyses for Machinery Fault ...
1 SOUND & VIBRATION/MAY 2010 Envelope and Cepstrum Analyses forMachinery Fault IdentificationAll rotating Machinery parts wear, as does ancient wisdom. Envelope and Cepstrum Analyses tend to be overlooked, but they are still useful tools to identify local Machinery faults. The intent of this article is to introduce these two tools in a pragmatic way and to demonstrate their properties by using a couple of practi-cal spectrum of a random or random-like signal is a continuous spectrum . The spectrum of a sine signal is a single discrete line in the spectrum . The spectrum of a repeated impulse, repetition period = T, is a discrete line spectrum throughout the frequency range of interest with a line spacing of 1/T local Fault in a machine could be a damaged tooth in a gear, a faulty turbine blade, a crack or spalling in a rolling element bear-ing, etc.
2 Each time a local Fault is engaged, the machine structure is exposed to an impact force, an impulse, and the corresponding vibration spectrum measured on the structure will contain all the harmonics of the repeated impact event. So, just as a sine signal is periodic in the time domain, the spectrum of a local Fault is periodic in the frequency domain, which is the property exploited in Envelope and Cepstrum noted, the response of a local Fault is measured somewhere on the structure and not where it originates. This means that the response is the repeated impact seen though a certain, unknown transmission mathematical terms, the response spectrum , Y(f), equals the product of the excitation spectrum , X(f), and the spectrum of transfer path, H(f): Y(f) = H(f) X(f).
3 Envelope analysis benefits from the inevitable resonances found in any mechanical structure. At resonances, H(f) amplifies X(f), the excitation, making it possible to identify local faults at a very early analysis bypasses the transmission path and reveals the Fault directly. This is important for trend Analyses in cases where the transmission path changes, because the mechanical structure changes, is modified, or the response accelerometer is not mounted in exactly the same way and position for every measurement. Envelope AnalysisEnvelope analysis, alias amplitude demodulation, dates back to the dawn of radio communication. In AM transmission, the information signal is amplitude modulated onto the carrier, which in turn is transmitted via the antenna.
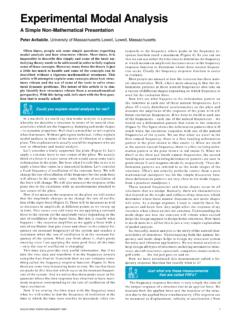
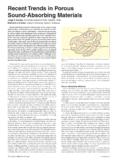
4 The purpose of the carrier is only to carry the information and facilitate the transmission. The receiver tunes in on the carrier frequency and demodulates the signal to retrieve the information signal. The demodulation is band pass filtering around the carrier frequency followed by detection; that is, the creation of the Envelope of the filtered signal, which is now the information signal that originally modulated the does this relate to identification of local faults in rotating Machinery ? As previously mentioned, the local Fault is manifested by the harmonics of the impact frequency. The response signal is the harmonics weighted by the transmission path, so the obvious frequency range in which to look for the harmonics is where the harmonics are predominant, which is around the structural reso-nances where the harmonics are 1a shows the response spectrum from a machine with and without a local Fault .
5 The green curve shows the vibration response to a single impact with an ordinary hammer while the machine is at rest. It shows a structural resonance at kHz. The red curve shows the response of the local Fault . The highlighted (yellow) part of the spectrum looks like the spectrum of an amplitude-modulated carrier, but there is no carrier to modulate. Just like the carrier in radio communication is the transmission facilitator, the structural resonance facilitates the transfer of the impact information. In short, the resonance is the (imaginary) carrier, and the impact in-formation can be retrieved by amplitude demodulation/ Envelope detection around the resonance. The result in the time domain and a subsequent Fourier transformation together constitute the Envelope analysis and gives the spectrum of the local Fault .
6 The result is shown in Figure 1b, the first eight harmonics of a local Fault with an occurrence of 42 Hz. The zoom spectrum around the resonance, Figure 1c, already holds the required information, but the result is most often not operational. If the first harmonic varies, say 1 Hz due to RPM variation, the Nth harmonic will vary by N Hz. The harmonics will smear, the higher harmonics will merge and the result is not intelligible not to mention the problems to deal with if more local faults at different occurrences are in : Local Faults in Roller BearingsRollers, or balls rolling over a Fault in a bearing, produce a series of force impacts. The rate of the impacts is determined by the RPM of the shaft involved and the geometry of the bearing. The repetition rates are denoted bearing frequencies and they are as follows:BPFO: ball passing frequency outer race, local Fault on outer raceBPFI: ball passing frequency inner race, local Fault on inner raceBFF: ball Fault frequency = 2 BSF, local Fault on rolling ele-mentBSF: ball spin frequency FTF: fundamental train frequency, Fault on the cage or mechani- cal loosenessMost bearing suppliers offer a bearing frequency calculator, where the inputs are the bearing type number and the RPM of the shaft involved and the output is the bearing frequencies; that is, the potential Fault Konstantin-Hansen and Henrik Herlufsen, Br el and Kj r, N rum, DenmarkFigure 1.
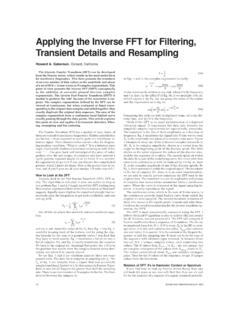
7 (a) Baseband spectrum ; (b) Envelope spectrum ; (c) Zoom SOUND & VIBRATION/MAY 2010 11 Second Modulation. As stated, the engagement of a local Fault produces an impact force. If the engagements are subjected to the same (radial) load, the resulting pulse train will be uniform as shown in Figure 2. The Fault in the outer, stationary race of the bearing is subjected to the same load for each over roll of the ball. A Fault on the rotating inner race, on the other hand, is subjected to a varying load, where the frequency of the load variation is the RPM of the inner race. Consequently, the Envelope signal will be amplitude modulated as shown in Figure 2. This is a real ampli-tude modulation that will show in the Envelope spectrum . This modulation should not be confused with the (pseudo) modulation of the structural resonances that is demodulated by the Envelope Propeller Shaft.
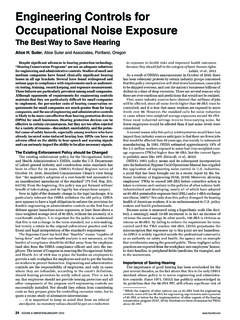
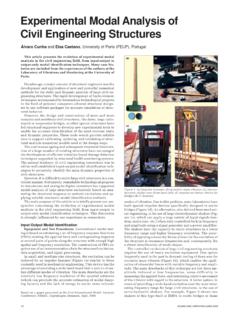
8 Figure 3a shows the vibration signal measured on a bearing of a ship propeller shaft. The signal clearly shows some impact events, and an audio playback of the vibra-tion signal definitely confirms the presence of a local Fault . The propulsion train comprises some 10 (different) bearings and a reduction gear, meaning there are at least 50 different local Fault 3b shows the baseband spectrum of the vibration signal. Unbalances, misalignments and gear-tooth meshing frequency show up at the lower frequencies, and the complete spectrum looks somewhat peaky, again suggesting a local Fault . The peak at kHz indicated by the yellow range looks like a structural resonance and invites Envelope analysis of the indicated range. Figure 3c shows the Envelope of the time signal that clearly en-hances the impact events.
9 And Figure 3d shows the final spectrum of the Envelope , from which the Fault can be Fault signature is that of a clean inner race crack. It shows three modulation groups around the three first harmonics of 35 Hz and modulation sidebands within the groups of Hz. The propeller shaft is running at 177 RPM = Hz, and at this speed, one of the bearings has a BPFI of 35 Hz. Together, this doubles the evidence for an inner race Fault in a particular bearing, which proved to be correct when the bearing was real power of the method is that it is able to identify multiple local faults with different Fault rates. The different faults will show as different harmonic families in the Envelope spectrum , which in turn can be identified using the harmonic AnalysisThe Cepstrum is a relative of the well-known autocorrelation, RAA(t), which can be derived from the autospectrum as:where F-1 is the inverse Fourier transform and SAA(f) is the au-tospectrum.
10 RAA(t) is in the time domain (more properly the lag-time domain. The autocorrelation reveals the delay information inherent in a periodic autospectrum. One example is identification of acoustic Cepstrum is derived similarly; it is the inverse Fourier transform of the logarithm of the autospectrum:This has two implications:The logarithm boosts lower levels of the autospectrum. This means that a low-level part of the spectrum that holds periodic information that would not show in the autocorrelation will show in the noted previously, the response spectrum is the product of the excitation spectrum and the spectrum of the transfer path: Y(f)=H(f) X(f) or in power terms:The Cepstrum of the response spectrum becomes:which means that the effect of the transfer path on the excitation is additive in the Cepstrum , and the two can be separated in the analysis, as will be shown term Cepstrum looks like a spelling error and is often cor-rected by proof readers.)