Transcription of Enzyme Action: Testing Catalase Activity - hannasd.org
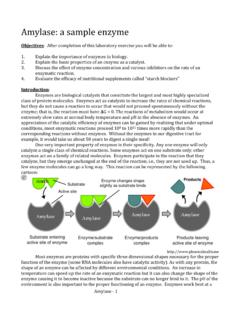
1 Science in Motion Lab #803 Enzyme action : Testing Catalase LQ by Vernier Software and Technology, Gettysburg College, Gettysburg, PA 17325. A Science in Motion Program -1- Enzyme action : Testing Catalase Activity Pennsylvania Science Standards: Keystone Eligible Content , , and Introduction and Background Many organisms can decompose hydrogen peroxide (H2O2) enzymatically. enzymes are globular proteins, responsible for most of the chemical activities of living organisms.
2 They act as catalysts, as substances that speed up chemical reactions without being destroyed or altered during the process. enzymes are extremely efficient and may be used over and over again. One Enzyme may catalyze thousands of reactions every second. Both the temperature and the pH at which enzymes function are extremely important. Most organisms have a preferred temperature range in which they survive, and their enzymes most likely function best within that temperature range. If the environment of the Enzyme is too acidic or too basic, the Enzyme may irreversibly denature, or unravel, until it no longer has the shape necessary for proper functioning.
3 H2O2 is toxic to most living organisms. Many organisms are capable of enzymatically destroying the H2O2 before it can do much damage. H2O2 can be converted to oxygen and water, as follows: 2 H2O2 2 H2O + O2 Although this reaction occurs spontaneously, enzymes increase the rate considerably. At least two different enzymes are known to catalyze this reaction: Catalase , found in animals and protists, and peroxidase, found in plants. A great deal can be learned about enzymes by studying the rates of Enzyme -catalyzed reactions . The rate of a chemical reaction may be studied in a number of ways including: measuring the pressure of the product as it appears (in this case, O2) measuring the rate of disappearance of substrate (in this case, H2O2) measuring the rate of appearance of a product (in this case, O2 which is given off as a gas) In this experiment, you will measure the rate of Enzyme Activity under various conditions, such as different Enzyme concentrations, pH values, and temperatures.
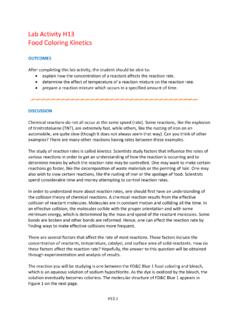
4 It is possible to measure the pressure of oxygen gas formed as H2O2 is destroyed. If a plot is made, it may appear similar to the graph shown. At the start of the reaction, there is no product, and the pressure is the same as the atmospheric pressure. After a short time, oxygen accumulates at a rather constant rate. The slope of the curve at this initial time is constant and is called the initial rate. As the peroxide is destroyed, less of it is available to react and the O2 is produced at lower rates . When no more peroxide is left, O2 is no longer produced. Science in Motion Lab #803 Enzyme action : Testing Catalase LQ by Vernier Software and Technology, Gettysburg College, Gettysburg, PA 17325.
5 A Science in Motion Program -2- Guiding Questions: How do changes in concentration, pH, and temperature affect the ability of enzymes to function? Vocabulary: Enzyme , Catalase , denature, catalyst Safety: Wear safety goggles Be cautious of over-pressurized test tubes. Be cautious of hot water. Materials Needed (per group): LabQuest pH group only: Vernier Gas Pressure Sensor pH buffers (4, 7, 10) pH group only 1-hole rubber stopper assembly Temperature group only: 10 mL graduated cylinder ice 250 mL beaker of tap water thermometer 3% H2O2 (about 12mL per group) Ring stand with clamp Enzyme suspension in small beaker (see teacher notes) 600 ml beaker four 18 X 150 mm test tubes Test tube rack Dropper pipette 1234 Science in Motion Lab #803 Enzyme action : Testing Catalase LQ by Vernier Software and Technology, Gettysburg College, Gettysburg, PA 17325.
6 A Science in Motion Program -3- Procedure (Part 1 - Testing the Effect of Enzyme Concentration): 1. Obtain and wear goggles. 2. Connect the plastic tubing to the valve on the Gas Pressure Sensor. 3. Connect the Gas Pressure Sensor to LabQuest and choose New from the File menu. If you have an older sensor that does not auto-ID, manually set up the sensor ( sensor menu sensor setup ) 4. On the Meter screen, tap Rate. Change the data-collection rate to samples/second and the data-collection length to 180 seconds. 5. Place four test tubes in a rack and label them 1, 2, 3, and 4.
7 6. Add 3 mL of H2O2 and 3 mL of water to each test tube as shown in Table 1. Table 1 Test tube label Volume of 3% H2O2 (ml) Volume of water (ml) 1 3 3 2 3 3 3 3 3 4 3 3 7. Use a clean dropper pipette to add 1 drop of Enzyme suspension to test tube 1. Note: Be sure not to let the Enzyme fall against the side of the test tube. 8. Insert the 1-hole stopper assembly into the test tube. Note: Firmly twist the stopper for an airtight fit. Gently swirl the test tube to thoroughly mix the contents. The reaction should begin. The next step should be completed as rapidly as possible.
8 9. Connect the free-end of the plastic tubing to the connector in the rubber stopper as shown in Figure 2. 10. Start data collection by tapping the green play button in the lower left corner. Data collection will end after 3 minutes. 11. Monitor the pressure readings displayed on the handheld screen. If the pressure exceeds 130 kPa, the pressure inside the tube will be too great and the rubber stopper is likely to pop off. Disconnect the plastic tubing from the Gas Pressure Sensor if the pressure exceeds 130 kPa. 12. When data collection has finished, an auto-scaled graph of pressure vs.
9 Time will be displayed. Disconnect the plastic tubing connector from the rubber stopper. Remove the rubber stopper from the test tube and discard the contents in a waste beaker. 13. To examine the data pairs on the displayed graph, select any data point. As you tap on each data point, the pressure and time values are displayed to the right of the graph. Figure 2 Figure 2 Science in Motion Lab #803 Enzyme action : Testing Catalase LQ by Vernier Software and Technology, Gettysburg College, Gettysburg, PA 17325.
10 A Science in Motion Program -4- 14. Determine the rate of Enzyme Activity for the curve of pressure vs. time. To help make comparisons between experimental runs, choose your data points at the same time value, ideally the point where the data values begin to increase and the point where the pressure values no longer increase. a. Choose Curve Fit from the Analyze menu (found on the graph screen). b. Select Linear for the Fit Equation. The linear-regression statistics for these two data columns are displayed for the equation in the form y = mx + b c. Enter the absolute value of the slope, m, as the reaction rate in Table 4.