Transcription of Enzyme Catalysis Lab Report-1 - University of Pennsylvania
1 1 Candace S. Randolph MISEP Cohort 2 Chemistry 512 Enzyme Catalysis Lab Report Pre-lab Questions: 1. Write a balanced chemical equation with state symbols for the reaction catalyzed by peroxidase. 2H2O2 2H2O + O2 (4H1 4O) (4H + 2O + 2O) 2. What is the substrate(s) of this reaction? What is the catalyst? Substrate = H2O2 hydrogen peroxide Catalyst = peroxide 3. At what approximate temperature do enzymes normally operate in the body of a warm-blooded animal? Would your answer change if the Enzyme came from a plant or yeast? enzymes normally operate in the body of a warm-blooded animal at the range of approximately 75 F - 100 F.
2 If the Enzyme came from a plant or yeast it would probably operate at a different temperature. 4. What allows peroxidase to be specific for its substrate? (In other words, why doesn t peroxidase catalyze other types of reactions?) Peroxidase is specific to its substrate because of its shape. 2 Experimental Lab: Abstract: An Enzyme is a protein that serves as a biological catalyst (Denniston, 2007).
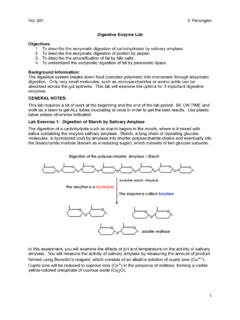
3 A catalyst is any substance that increases the rate of a chemical reaction (by lowering the activation energy of the reaction) (Denniston, 2007). In this experiment we are using Hydrogen peroxide (the substrate for this experiment) is. Peroxidase is a soluble Enzyme normally found in the cytoplasm of cells. Our experimental design was to find out if decreasing the amount of substrate will affect the reaction rate of the Enzyme . For this experiment we used yeast as our peroxidase. The amount of Enzyme was kept constant for this experiment. Because the catalyst remained constant the group s original hypothesis was, as we decrease the amount of substrate reaction will speed up.
4 (The slope of the line will get steeper.) We decreased the amount of substrate for each reaction assuming that the result would increase the reaction rate of the reaction. Materials: Water Yeast ( Enzyme ) Test tubes Stoppers Logger Pro and Laptop computer Substrate (peroxidase) Graduated cylinders Eye droppers 3 Methods: (See lab for procedure notes) Using a graduated cylinder (to measure accurately) pour the desired amount of substrate and water into each test tube. Do not mix the Enzyme with the mixture until you are ready to measure the rate of reaction for each individual tube.
5 In table 1 each tube is labeled with a letter and number. The 1 s are for the first trial and the 2 s are for the second trial. (If time permits, perform the experiment at least two times.) 1. Pour 5ml of substrate, 0ml of Enzyme (no Enzyme for negative control), and .5ml of water into test tube A1. 2. Seal test tube A1 with a stopper immediately after the Enzyme is added. 3. Record the reaction rate using the Logger Pro software. 4. Repeat steps 1-3 using the new measurements as described in table 1. Table 1 Substrate Enzyme Water Total Negative control 5ml (A1) (A2) 0ml.
6 5ml Positive control 5ml (B1) (B2) .5ml 0ml 4ml (C1) (C2) .5ml 1ml 3ml (D1) (D2) .5ml 2ml 2ml (E1) (E2) .5ml 3ml 1ml (F1) (F2) .5ml 4ml 4 Results: Trial #1 Reaction/Slope Trial #2 Reaction/Slope Average Standard Deviation A1 No change A2 No change No change B1 kPa/s B2 kPa/s kPa/s .0132 C1 kPa/s C2 kPa/s kPa/s .00205 D1 kPa/s D2 kPa/s kPa/s .0062 E1 kPa/s E2 kPa/s kPa/s .0079 F1 kPa/s F2 kPa/s kPa/s The above table summarizes the result of the experiment. The experiment was performed two times.
7 The average reaction (slope) is in column five and the standard deviation is noted in column six. Our original hypothesis was that as we decrease the amount of substrate reaction will speed up. (The slope of the line will get steeper.) We were incorrect. As we decreased the amount of substrate while the Enzyme was kept constant resulted in a decrease of the reaction rate for the mixture. Discussion: The results of this experiment show me how there must be a balance between the amount of substrate and the amount of Enzyme in a reaction. In our experiment the reaction rate did not increase, it decreased.
8 Because we reduced the amount of substrate in each mixture but kept the amount of Enzyme the same the Enzyme cannot react with what is not there. The Yeast ( Enzyme ) was the catalyst in the experiment, and not having the same amount of substrate did not cause the 5 reaction to take place faster, it caused the Enzyme to not be used. This is why the reaction rate of the mixture did not increase it decreased. Therefore the slope of the reaction declined as we reduced the amount of the substrate in each reaction. Trial one and two did not produce the same reaction rate.
9 This can be attributed to how the chemicals were measured for each mixture or the speed at which the stopper was inserted into the test tube. Therefore the results were different in each trail. As a result I calculated the average reaction rate for each mixture and the standard deviation for each (A1 vs. A2 and B1 vs B2 and so on). The procedure could be improved to minimize these sources of error by timing each step of the process to make sure each chemical was exposed to air the same amount of time before the test tube was plugged/corked. We did try to eliminate one aspect of human error by having the same person perform the same task in the experiment each time.
10 It is hard to pinpoint the exact element that result in the variations between trial one and trial two. Perhaps if we had more time, we could have performed the experiment more times to produce results that did not have such a large standard deviation.