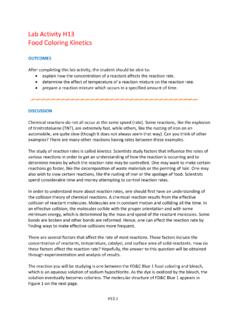
Transcription of Enzymes and Cellular Regulation - POGIL
1 Enzymes and Cellular Regulation 1 Enzymes and Cellular RegulationWhat are the factors that regulate the rate at which Enzymes catalyze reactions ?Why?Digestive Enzymes are protein-based biological catalysts that play important roles in our lives. They help remove stains from our shirts, turn milk into cheese, and are responsible for turning our dinner into use-able fuel for our bodies. Enzymes however do not work well universally. Some are meant to work at high temperatures, others at low temperatures. They may work best in acidic conditions or neutral conditions. In this activity we will look at the optimal conditions for two different Enzymes .
2 The digestive enzyme lipase is made in the pancreas and breaks down lipids in the small intestine, while pepsin breaks down proteins in the 1 Two Digestive Enzymes lipaseTriglycerides glycerol + fatty acids pepsinLarge polypeptides smaller polypeptides + amino acidsEffect of pH on Enzyme ActivitypH02468101214 Pepsin (stomach)Rate of reactionLipase 1. Name the two Enzymes illustrated in Model 1. 2. Consider the information provided in the Why? box and in Model 1 about these I n which body organ is pepsin active?
3 B. I n which body organ is pancreatic lipase active? 2012, Flinn Scientific, Inc. and HSPI The POGIL Project. All Rights Reserved. Reproduced for one-time use with permission from Flinn Scientific, Inc. Batavia, Illinois, No part of this material may be reproduced or transmitted in any form or by any means, electronic or mechanical, including, but not limited to photocopy, recording, or any information storage and retrieval system, without permission in writing from Flinn Scientific, POGIL Activities for AP* Biology 3.
4 For each enzyme in Model 1, circle the pH that best represents the environment in which the enzyme is most active. Pepsin 8 Lipase 8 4. Compare the rate of the pepsin-catalyzed reaction at pH with the rate of the lipase-catalyzed reaction at pH 5. Compare the rate of the pepsin-catalyzed reaction at pH 8 with the rate of the lipase-catalyzed reaction at pH 8. 6. Using your knowledge of protein structure, explain in detail the effect of exposing an enzyme to a pH outside of its optimal range. Include the effect on both enzyme structure and function.
5 7. At what pH values is lipase likely to be denatured? Justify your answer. 8. At what pH values is pepsin likely to be denatured? Justify your answer. 9. In addition to being produced in the pancreas, lipase is also produced in the stomach. Is the structure of pancreatic lipase the same as gastric (produced in the stomach) lipase? Justify your reasoning. 10. Add a line to the graph in Model 1 that shows a prediction for gastric lipase Antacids work by neutralizing acids, bringing the pH of the stomach to a range of 6 7. What is the effect of taking an antacid on a person s ability to digest proteins?
6 2012, Flinn Scientific, Inc. and HSPI The POGIL Project. All Rights Reserved. Reproduced for one-time use with permission from Flinn Scientific, Inc. Batavia, Illinois, No part of this material may be reproduced or transmitted in any form or by any means, electronic or mechanical, including, but not limited to photocopy, recording, or any information storage and retrieval system, without permission in writing from Flinn Scientific, and Cellular Regulation 3 Model 2 Amylase Rate of ReactionTemperature, CEnzyme concentration(Substrate concentration always in excess)Rate of reactionRate of reactionSubstrate concentration(Enzyme concentration constant)Rate of reaction020406080100 ABC12.
7 Amylase is an enzyme that catalyzes the digestion of carbohydrates. The graphs in Model 2 pro-vide data on several factors that affect the function of amylase in the The relationship of which two variables is illustrated in graph A of Model 2? b. The relationship of which two variables is illustrated in graph B or Model 2? c. The relationship of which two variables is illustrated in graph C or Model 2? 13. Refer to Model What is the optimum temperature for amylase? b. What is the biological significance of the temperature at which the amylase-catalyzed reaction is fastest?
8 2012, Flinn Scientific, Inc. and HSPI The POGIL Project. All Rights Reserved. Reproduced for one-time use with permission from Flinn Scientific, Inc. Batavia, Illinois, No part of this material may be reproduced or transmitted in any form or by any means, electronic or mechanical, including, but not limited to photocopy, recording, or any information storage and retrieval system, without permission in writing from Flinn Scientific, POGIL Activities for AP* Biology14.
9 Predict what causes a decrease in enzyme activity at temperatures above 37 C. 15. A young child runs a fever of 40 C for 24 hours. Explain what effect this may have on his digestion. 16. Consider the data in graph B of Model Describe the relationship between enzyme concentration and reaction rate. b. Propose an explanation for this relationship. 17. Consider the data in graph C of Model What is the relationship between substrate concentration and the reaction rate? b. Propose an explanation for why a maximum reaction rate is reached in graph C. 18. As a group, develop an analogy for the function of an enzyme that will explain the concentration graphs in Model 2 (graphs B and C).
10 19. Would the reaction rate on graph B of Model 2 ever reach a maximum level? Justify your answer. 2012, Flinn Scientific, Inc. and HSPI The POGIL Project. All Rights Reserved. Reproduced for one-time use with permission from Flinn Scientific, Inc. Batavia, Illinois, No part of this material may be reproduced or transmitted in any form or by any means, electronic or mechanical, including, but not limited to photocopy, recording, or any information storage and retrieval system, without permission in writing from Flinn Scientific, and Cellular Regulation 5 Extension Questions20.