Transcription of Epidemiology and Immunization Services Branch (EISB) COVID ...
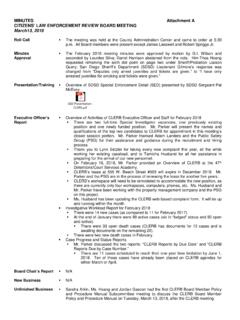
1 Epidemiology and Immunization Services Branch (EISB). COVID -19 Vaccinations Report - San Diego County Residents Who Received at Least One Dose of COVID -19 Vaccine Data through 2/8/2022, updated 2/9/2022 8:00 AM. Data are preliminary and subject to change San Diego County Residents Ages 5 Years and Older Who Received at Least One Dose of COVID -19 Vaccine Percentage of 5 Years and Older Percentage of Total Total Vaccinated Population Vaccination Rate per 1,000*. Population Vaccinated Vaccinated 3,144,061 2,662,237 Selected Characteristics Age Groups 5-11 years 310,643 ( ) 117,288 12-19 years 348,875 ( ) 270,325 20-29 years 530,914 ( ) 409,304 30-39 years 490,015 ( ) 417,042 40-49 years 399,133 ( ) 374,988 50-59 years 404,449 ( ) 382,041 60-69 years 340,304 ( ) 350,579 99%^ ^. 70-79 years 199,899 ( ) 223,654 99%^ ^. 80+ years 119,829 ( ) 116,903 Age Unknown 113 Gender Female 1,559,875 ( ) 1,398,158 Male 1,584,186 ( ) 1,254,191 Gender Unknown 9,888 HHSA Region**.
2 Central 482,693 ( ) 389,918 East 458,054 ( ) 335,142 North Central 630,661 ( ) 540,244 North Coastal 526,680 ( ) 389,025 North Inland 577,410 ( ) 455,804 South 468,563 ( ) 500,001 99%^ ^. HHSA Region Unknown 52,103 Race/Ethnicity**. Hispanic or Latino 1,006,970 ( ) 793,471 White 1,430,687 ( ) 969,417 Black or African American 158,801 ( ) 81,219 Asian 407,173 ( ) 312,265 Native Hawaiian or Other Pacific Islander 13,527 ( ) 17,517 99%^ ^. American Indian or Alaska Native 20,703 ( ) 11,286 Other/Multiple Race 106,200 ( ) 368,333 99%^ ^. Race and Ethnicity Unknown 108,729 Individuals vaccinated by Veterans Affairs or Department of Defense are not included. COVID -19 vaccine is not approved for those under age 5 at this time. Data are preliminary and subject to change. An additional 186,356 non-San Diego residents and 45,483 persons with unknown location of residence were vaccinated at San Diego County sites.
3 *Rates are calculated using 2019 population estimates from the San Diego Association of Governments. **HHSA Region determined by resident zip code or city; some zip codes not available. **Persons of Hispanic/Latino ethnicity may belong to any race group. All categories except Hispanic/Latino include persons for whom race is known but ethnicity is non-Hispanic or unknown. SDIR categorizes "Multiple Races" as "Other Race" so all people who report being multiple races are categorized as "Other Race." "Other Race" may not have a standardized definition across data collecting entities or among patients reporting their own demographics. ^The percentage and rate of the population vaccinated with at least one dose of COVID -19 vaccine may approach, or exceed, 99% or 999 per 1,000 San Diego residents aged 5 years and older. The most recent age, gender, region, and race/ethnicity population are 2019 estimates, which may under estimate the current population.
4 When these demographics are analyzed, the population estimates may not reflect social and environmental changes of a community, possibly leading to an under- or overestimate of a population. Data source: San Diego Immunization Registry, SANDAG 2019 Population Estimates (Prepared June 2020). Total population 5 years of age and older=3,144,061. Prepared by the County of San Diego, Health and Human Services Agency, Public Health Services , Epidemiology and Immunization Services Branch