Transcription of Equity-Bond Correlation: A Historical Perspective
1 Graham Capital ManagementResearch Note, september 2017 Equity-Bond Correlation: A Historical PerspectiveJack Fan1, Marci Mitchell2 AbstractThe Equity-Bond correlation has been negative since the early 2000s. A certain conventional wisdom has developedthat this negative correlation is natural and enduring. However, when we take a much longer Historical Perspective andexamine data going back to 1870s, we find that the Equity-Bond correlation is highly dynamic and has gone throughprolonged periods of positive correlation. As such, we should not dogmatically assume that the Equity-Bond correlationwill be negative going forward, especially in the context of asset allocation and portfolio ; Stocks; Bonds; Beta1 Quantitative Research Manager2 Quantitative Research Analyst1.
2 IntroductionEquity- bond correlation is immensely important for a multitude ofportfolio management tasks ranging from asset allocation to riskmanagement. Despite a developing conventional wisdom overrecent years that equity and bond prices are negatively correlated,the reality is far more time and across a variety of monetary policy regimes, Equity-Bond correlation is actually more likely to be positive thannegative. Since the 1870s, Equity-Bond five-year correlation hasbeen negative in 635 months compared to 1,063 months when itwas positive. The modern regime of negative correlation reallybegan around the late 90s. Since 2015, it has been slowly movingback towards zero.
3 As a result, we should be wary of making hardassumptions about the magnitude or direction of future Equity-Bond Economic BackgroundThere is no generally accepted model for Equity-Bond correlationdespite the rich volume of literature on this topic in macroeco-nomics. Significantly, academic research has yet to even reachagreement on whether bond and equity prices should move to-gether or in opposite example, Shiller and Beltratti (1992) managed to findtheoretical motivation for both positive and negative correlationsbased on a discounted dividends view of equities. equity valua-tion is linked to bonds through the discount factor. In the mostbasic configuration, equities should have positive correlation tointerest rates.
4 However, this is not observed (Leibowitz andKogelman, 1993).Baele (2010) tried to decompose the time-series of the Equity-Bond correlation onto a set of macroeconomic factors. Interest-ingly, they found that fundamental factors such as inflation andoutput gap do not generate the kind of time-variability that isobserved in the realized Equity-Bond correlation. They did find,however, that additional factors, such as liquidity proxies, play animportant role in mediating the relationship between equities andbonds. Taken together, these results suggest that the equity -bondcorrelation is not the strict result of monetary policy regimes, butresponsive to a wider set of market correlation can be volatile, time varying, and noteasily explained by any given set of fundamental factors.
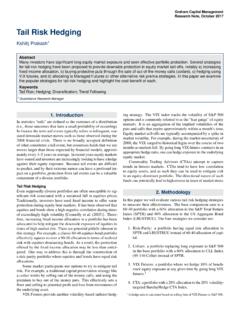
5 Thereis no exact set of known factors that can explain it or provide abasis for A Historical PerspectiveFor our analysis, we use Shiller s monthly data set1for equityreturns and long term bond yields (see Figure 1 for S&P 500levels and long yields since 1872). This data set is particularlyremarkable for its longevity, stretching across multiple monetarypolicy regimes all back to the 1870s. While the period thatpredates the Federal Reserve System may not be as relevant,we hope to use it as additional context for considering whatequity- bond correlation may look like under a system completelydifferent from the current 500 Long Yield (%)1900195020000500100015002000250048121 6 Figure level and long yields dating back to data is available courtesy of Shiller (2005) and can be found here: Correlation.
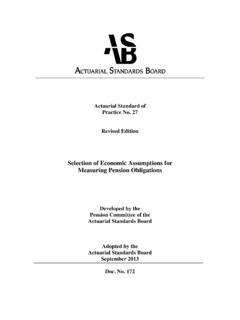
6 A Historical Perspective 2/4 Federal Reserve Act Federal Reserve Independence Nixon announces break from gold standard Great Depression Most recent regime shift Figure one-year (red) and five-year (blue) correlation between monthly equity and bond returns dating back to approximate the returns of a ten-year treasury bond fromthe bond yields. Treasury total returns is comprised of two com-ponents: price change and carry. The monthly price change wederive by multiplying change in yield level for that month by ahypothetical fixed duration of nine years. For the carry part, weuse the prorated par yield of the previous month. Our approx-imation is not perfect as it ignores curve roll down at the veryleast.
7 However, in our experience it is a reasonable method ofestimating total returns for treasury then compute the rolling one-year and five-year correla-tions between equity and bond returns over this very long his-torical period. The results are plotted in Figure 2. The averagesof both one-year and five-year correlations between equity andbonds are very close to zero (3% and 7% respectively) over theirentire history. However, Equity-Bond correlation cycles throughperiods of significant positives and negatives. This underlines ourview that we should not think of their nature as static, but ratheras a dynamic process that evolves over correlation appears to be very volatile prior to themodern monetary policy system anchored by the Federal Reserve,fluctuating between positive and negative.
8 There was a sharpdrop in correlation leading up to the Recession of 1913, which,perhaps as a result of the Federal Reserve Act, seems to abruptlyand rapidly reverse to become major subsequent events seem to presage the relative sta-ble periods in Equity-Bond correlation: in 1951 when the FederalReserve System asserted its independence from the Treasury De-partment and when the dollar broke from the gold standardtwenty years does not seem to be a stable relationship between re-cessions and correlation. The sign of correlation between equityand bond changed twice over the course of the Great correlations were positive in six out of the last ten re-cessions as defined by NBER2.
9 The same is true if we look atone-year correlations as the initial periods of growth and inflation throughthe 1980s, correlation between equities and bonds was positive(over a 5- year rolling window), peaking in 1997, but remainingpositive until the early 2000s. From then on, correlation turned2 Campbell et al. (2014) suggests that this is a result oftransition from being focused on bond risk in the 1980s to outputfluctuation and the persistence of monetary policy length and magnitude of the current negative correla-tion regime that started in the 2000s has been 2012 registered the lowest one-year correlation at -91% andMarch 2015 registered the lowest five-year correlation at -68%.
10 The highest one-year is 88% in september 1983 and 56% inDecember 1986 for five-year 2015, Equity-Bond correlations have been rapidly ris-ing. We could attempt to ascribe this to fundamental factors suchas increases in inflation expectation and/or expectations for atighter monetary policy. However, we caution restraint in inter-pretation but note that one should not be surprised if equity -bondcorrelation breaks into positive territory for a sustained period oftime4. ConclusionsEquity- bond correlation is not a static number. It can be bothpositive and negative. The observed correlation is the result of richand dynamic interaction between a multitude of macroeconomicfactors.