Transcription of Estimating a VAR - LearnEconometrics.com
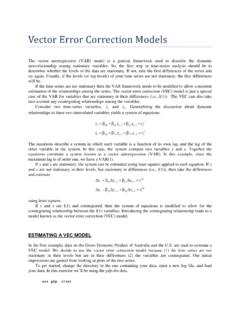
1 Estimating a VAR The vector autoregressive model (VAR) is actually simpler to estimate than the VEC model. It is used when there is no cointegration among the variables and it is estimated using time series that have been transformed to their stationary values. In the example from your book, we have macroeconomic data log of real personal disposable income (denoted as Y) and log of real personal consumption expenditure (denoted as C) for the economy over the period 1960:1 to 2009:4 that are found in the dataset. As in the previous example, the first step is to determine whether the variables are stationary.
2 If they are not, then difference them, checking to make sure that the differences are stationary ( , the levels are integrated). Next, test for cointegration. If they are cointegrated, estimate the VEC model. If not, use the differences and lagged differences to estimate a VAR. model. Load the data. In this exercise we ll be using the data. use fred, clear The data are quarterly and begin in 1960q1 and extend to 2009q4. Just as we did in the example above, sequences of quarterly dates: gen date = q(1960q1) + _n - 1 format %tq date tsset date The first step is to plot the series in order to identify whether constants or trends should be included in the tests of nonstationarity.
3 Both the levels and differences are plotted. tsline lc ly, legend(lab (1 "ln(RPCE)") lab(2 "ln(RPDI)")) /// name(l1, replace) tsline , legend(lab (1 "ln(RPCE)") lab(2 "ln(RPDI)")) /// name(d1, replace) (RPCE)ln(RPDI) The levels series appear to be trending together. The differences show no obvious trend, but the mean of the series appears to be greater than zero, suggesting that a constant be included in the ADF regressions. The other decision that needs to be made is the number of lagged differences to include in the augmented Dickey-Fuller regressions.
4 The principle to follow is to include just enough so that the residuals of the ADF regression are not autocorrelated. So, start out with a basic regression that contains no lags, estimate the DF regression, then use the LM test discussed earlier to determine whether the residuals are autocorrelated. Add enough lags to eliminate the autocorrelation among residuals. If this strategy is pursued in Stata, then the ADF regressions will have to be explicitly estimated; the estat bgodfrey command will not be based on the proper regression if issued after dfuller.
5 The regressions for the ADF tests are qui reg L(1/1). estat bgodfrey, lags(1 2 3) qui reg L(1/2). estat bgodfrey, lags(1 2 3) qui reg L(1/3). estat bgodfrey, lags(1 2 3) The test results for the last two regressions appear below. (RPCE)ln(RPDI) It is clear that the residuals of the ADF(2) are autocorrelated and those of the ADF(3) are not. The resulting ADF statistic is obtained using: dfuller lc, lags(3) where the indicated number of lags is used. Note also that this regression contains a constant and that the test statistic is The unit root hypothesis is not rejected at the 5% level.
6 For the income series, loops are used to reduce the amount of coding. Two side benefits are 1) less output and 2) smaller probability of a coding error. Of course, if what s put in the body of the loop is coded with an error, then all of your results will be wrong! At any rate, here is the example for income: forvalues p = 1/3 { qui reg L(0/`p'). di "Lags =" `p' estat bgodfrey, lags(1 2 3) } As seen earlier in the course, the loop structure is fairly easy to use. It starts with forvalues p, where p is the counter, and p is instructed to increment beginning at 1 and ending at 3.
7 The default increment size is one. Thus p will be set at 1, 2 and 3 as the loop runs. The first line must end with a left brace {. In the body of the loop are the regression, a display statement to indicate the lag length, and a call to the post- H0: no serial correlation 3 3 2 2 1 1 lags(p) chi2 df Prob > chi2 Breusch-Godfrey LM test for autocorrelation.}
8 Estat bgodfrey, lags(1 2 3)Lags = 3. di "Lags = 3". qui reg L(0/3). H0: no serial correlation 3 3 2 2 1 1 lags(p) chi2 df Prob > chi2 Breusch-Godfrey LM test for autocorrelation.
9 Estat bgodfrey, lags(1 2 3)MacKinnon approximate p-value for Z(t) = Z(t) Statistic Value Value Value Test 1% Critical 5% Critical 10% Critical Interpolated Dickey-Fuller Augmented Dickey-Fuller test for unit root Number of obs = 196.
10 Dfuller lc, lags(3)estimation command bgodfrey. The loop has to be closed on a separate line using a right brace }. After initializing the counter, p, it must be referred to in single quotes (left ` and right which as you may recall are different characters on the keyboard). This is as it appears in the first two lines of the loop s body. The output is: If nothing else, the output is a lot neater looking since none of the commands are echoed to the screen. For this series, no lagged differences of ly are included as regressors ( , the regular Dickey-Fuller regression).