Transcription of Estimating CO2 emissions supporting low carbon IGT report
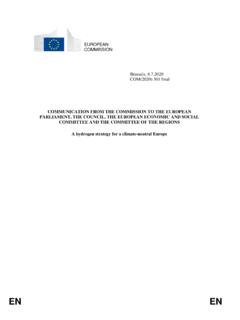
1 Estimating THE AMOUNT OF. CO2 emissions THAT THE. CONSTRUCTION INDUSTRY CAN. INFLUENCE. supporting material for the Low carbon Construction IGT report AUTUMN 2010. 1. Estimating the amount of CO2 emissions that the construction industry can influence The IGT report includes an estimate of the amount of CO2 emissions 1 that are relevant for different elements of the construction process. The purpose of this exercise was to estimate a distribution of CO2 emissions that the construction industry has the ability to influence. This should not be interpreted as the amount of emissions the construction industry is directly responsible for. Methodology This calculation takes a holistic view of the CO2emissions that construction industry has the ability to influence, piecing together existing evidence on CO2emitted across the broad areas of a building's life cycle. Figure 1: Broad areas of a building's life cycle. Design CO2emissions will occur early from the process of design energy and transport use by architects/planners/engineers.
2 However, the real scope for this sector to reduce CO2is through the impact design makes on in-use emissions , passive/active ventilation, solar gain. Manufacture A measure is included forCO2emissions associated with the domestic production of construction products/materials as well as emissions embodied in imported products/materials. 1. CO2 makes up roughly five sixths of Greenhouse Gases (GHGs), which are targeted for reduction by the Kyoto Protocol and the Climate Change Act2008 (CCA). The figures quoted here are limited to CO2 because there is evidence that emissions of non- CO2 GHGs as a result of energy and fuel use by the construction industry, and the buildings that it influences, are minimal, hence the greatest scope for reduction by construction lies in CO2. It is noted however, that there are emissions of non-CO2 GHGs in the manufacture of some construction products and materials and these would fall within the scope of the CCA. 2. Distribution CO2emitted as materials and people are transported to and from site.
3 This is broadly split into freight and business travel. On-site Operations This would cover direct and indirect CO2emissions ( combustion and energy use) from on-site operations. Note: refurbishment and demolition are accounted for separately, see below. In-Use emissions The CO2emissions resulting from the behaviour that takes place in buildings is included; the scope to which the construction industry can influence this is debatable. Refurb/Demolish Includes direct and indirect CO2emissions ( combustion and energy use). from demolition and waste removal, as well as the process of refurbishment. Data To obtain a broad level view, a top down approach has been pursued, using evidence from the ONS (Environmental Accounts, National Inventory or CRF figures) as well as, DECC and industry sources to achieve an estimate for the required element of construction. This is combined with a bottom-up approach for some sectors in order to estimate relative efficiency in tCO2/ . Results This estimate is a first attempt to approximate the magnitude of CO2that the process of construction can influence.
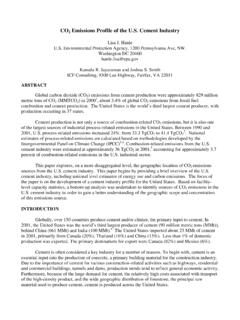
4 These estimates are broadly consistent with those from a similar exercise by UKGBC 2 . From the results, three main messages seem to be clear: The amount of CO2 emissions that construction can influence is significant, accounting for almost 47% of total CO2 emissions of the UK. 2. UKGBC estimate uses the UK GHG inventory 1990 to 2006 (hence slight difference in numbers) and estimates cover of CO2 emissions from Non-Dom. It applies a breakdown of building type applied to GHG inventory from BRE data (2002) ( & ). Includes unregulated use, as applies proportion of domestic carbon emissions to total carbon emissions . 3. In-Use building emissions accounts for the largest proportion, over 80%, of total CO2emissions that construction can influence. Manufacture (of construction products and materials) accounts for the largest amount of emissions within the process of construction. Figure 2: Amount of CO2emissions which the construction industry has the ability to influence 2008 3. 2. Sub-Sector MtCO % of total Design Manufacture 15%.
5 Distribution 1%. Operations on- 1%. site In Use 83%. Refurb/Demolition Total 100%. Assumptions and Caveats Design This is derived by multiplying an approximation for total employees in architecture and engineering by an average per employee CO2 factor derived from a sample of relevant companies, which comprises CO2 emissions from energy use and business travel. 3. Percentages do not added up to 100% due to rounding 4. Sources: Annual Business Inquiry: Employment in engineering/design SIC 71 - Architecture & technical consultancy 2008 (449,000). Arup/Mott MacDonald CR reports (leads to assumption of 3tC02 per employee per year). Mt CO2. Architecture, engineering& technical consultancy. Manufacture The products sub-sectors are taken from the Environmental Accounts 4 , which give tonnes of CO2associated with domestic production by product category. Including these sectors assumes that emissions from these sectors are wholly included within the manufacture of construction products. This will not be the case for all sub-sectors, but this is our working assumption.
6 The exception is the category Iron and steel, Non-ferrous metals, Metal castings', which accounts for a significant volume of emissions . It is assumed that 28% 5 of the emissions from this product category are attributable to products related to construction. The Environmental accounts figures were taken from 2006, and were deflated in line with the economy wide reduction inCO2 from 2006 to 2008 ( ). emissions embedded in imports is taken from DECC embedded carbon indicator 6 for growth rate was applied to 2008. We have worked with the Construction Products Association in developing these assumptions. Sub-sector Mt CO2. Wood and wood products Paints, varnishes, printing ink etc Rubber products Plastic products 3. Glass and glass products Structural clay products, Cement, lime and 4. Table 68 Air emissions for 2006: #. 4261. 5. This proportion is estimated by calculating the proportion of consumption for this category accounted for by construction products from ONS Supply and Use tables 2008.
7 Construction products were taken to consist of product codes 42, 49, 51-57 (assuming 50% of 54-56) and 88. The tables used were the 2008 supply tables and the 2008 intermediate consumption table from the ONS supply and use tables: . 6. Page75, 5. plaster Articles of concrete, stone etc Metal products Iron and steel, Non-ferrous metals, Metal castings (Assumed 28% of this category) Embedded emissions in imported construction products 2004. Total Distribution Figures are taken from the Baseline carbon assessment for 2008 work carried out by Strategic Forum for Construction & carbon Trust 7 . This work uses evidence reported by industry on energy intensity per of output in different elements of the construction process, which is then converted into carbon by using fuel conversion factors. This is combined with outputs figures from the ONS to derive an approximation 8 for different sub- sectors 9 . Sub-sector Mt CO2. Freight transport Business travel Total: On-site Operations Figures are taken from the Baseline carbon assessment for 2008 work carried out by Strategic Forum for Construction & carbon Trust for the UK 10 11.
8 Note: Refurbishment and waste removals are reported under Refurb/Demolition. Sub-sector Mt CO2. Site activities Off site assembly Off site offices Total: 7. %20A%20for%20public% 8. Assumptions available at: 9. Category figures for UK derived by applying proportions for GB to total UK emissions 10. Category figures for UK derived by applying proportions for GB to total UK emissions 11. %20A%20for%20public% 6. In-Use Figures are taken from published figures on residential and non-residential emissions . The carbon Trust figure for Non-domestic buildings is for 2005, and so is deflated in line with the economy wide reduction inCO2from 2005 to 2008 (- 4%). The figure is also net of non-domestic building emissions included in the estimates for Design and On-site operations. In practice this means subtracting the CO2 figure for Off-site offices' from the Strategic Forum work, and emissions related to energy use from design buildings, which are assumed to be 56% of the total this proportion being the average of office energy useCO2emissions to totalCO2 emissions from ARUP and Mott MacDonald carbon footprints.
9 Sub-sector Mt CO2. Residential: DECC figures by National Communication categories 2008: Residential emissions . Non-Residential: carbon Trust report , BRE. (2005) + carbon Trust Analysis. Deflated to 2008. Minus associated non-dom emissions from Design and Onsite operations. Total: Refurb/Demolition Figures are taken from the Baseline carbon assessment for 2008 work carried out by Strategic Forum for Construction & carbon Trust for the UK in 2008 12 13 . Sub-sector Mt CO2. Refurbishment and Maintenance Waste site removals Total: 12. Category figures for UK derived by applying proportions for GB to total UK emissions 13. %20A%20for%20public% 7. Crown copyright 2010. You may re-use this information (not including logos) free of charge in any format or medium, under the terms of the Open Government Licence. To view this licence, visit or write to the Information Policy Team, The National Archives, Kew, London TW9 4DU, or e-mail: This publication is also available on our website at Any enquiries regarding this publication should be sent to: Department for Business, Innovation and Skills 1 Victoria Street London SW1H 0ET.
10 Tel: 020 7215 5000. If you require this publication in an alternative format, email or call 020 7215 5000. 8. URN 10/1316. 9.