Transcription of Estimating Crystallite Size Using XRD
1 Estimating Crystallite SizeEstimating Crystallite SizeEstimating Crystallite SizeEstimating Crystallite SizeUsing XRDU sing XRDU sing XRDU sing XRDS cott A Speakman, Center for Materials Science and EngineeringCenter for Materials Science and These slides have not been extensively proof-read, and therefore may contain errors. While I have tried to cite all references, I may have missed some these slides were prepared for an informal lecture and not for publication. If you note a mistake or a missing citation, please let me know and I will correct it. I hope to add commentary in the notes section of these slides, offering additional details. However, these notes are incomplete so far.
2 Center for Materials Science and of Today s Lecture Provide a quick overview of the theory behind peak profile analysis Discuss practical considerations for analysis Demonstrate the use of lab software for analysis empirical peak fitting Using MDI Jade Rietveld refinement Using HighScore Plus Discuss other software for peak profile analysis Briefly mention other peak profile analysis methods Warren Averbach Variance method Mixed peak profiling whole pattern Discuss other ways to evaluate Crystallite size Assumptions: you understand the basics of crystallography, X-ray diffraction, and the operation of a Bragg-Brentano diffractometerCenter for Materials Science and Brief History of XRD 1895- R ntgen publishes the discovery of X-rays 1912- Laue observes diffraction of X-rays from a crystal when did Scherrer use Xwhen did Scherrer use Xwhen did Scherrer use Xwhen did Scherrer use X----rays to estimate the rays to estimate the rays to estimate the rays to estimate the Crystallite size of nanophase materials?
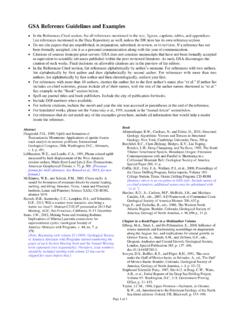
3 Crystallite size of nanophase materials? Crystallite size of nanophase materials? Crystallite size of nanophase materials?Center for Materials Science and Scherrer Equation was published in 1918 Peak width (B) is inversely proportional to Crystallite size (L) P. Scherrer, Bestimmung der Gr sse und der inneren Struktur von Kolloidteilchen mittels R ntgenstrahlen, Nachr. Ges. Wiss. G ttingen26(1918) pp 98-100. Langford and Wilson, Scherrer after Sixty Years: A Survey and Some New Results in the Determination of Crystallite Size, J. Appl. (1978) pp 102-113.() cos2 LKB=Center for Materials Science and Laue Equations describe the intensity of a diffracted peak from a single parallelopipeden crystal N1, N2, and N3are the number of unit cells along the a1, a2, and a3directions When N is small, the diffraction peaks become broader The peak area remains constant independent of N()()()()()()()()()()()()323322222212112 2/sin/sin/sin/sin/sin/sinassaNssassaNssa ssaNssFIIOOOOOOe = for Materials Science and of these diffraction patterns comes from a nanocrystalline material?
4 6667686970717273742 (deg.)Intensity ( ) These diffraction patterns were produced from the exact same sample Two different diffractometers, with different optical configurations, were used The apparent peak broadening is due solely to the instrumentationCenter for Materials Science and factors may contribute tothe observed peak profile Instrumental Peak Profile Crystallite Size Microstrain Non-uniform Lattice Distortions faulting Dislocations Antiphase Domain Boundaries Grain Surface Relaxation Solid Solution Inhomogeneity Temperature Factors The peak profile is a convolution of the profiles from all of these contributionsCenter for Materials Science and and Sample Contributions to the Peak Profile must be Deconvoluted In order to analyze Crystallite size, we must deconvolute.
5 Instrumental Broadening FW(I) also referred to as the Instrumental Profile, Instrumental FWHM Curve, Instrumental Peak Profile Specimen Broadening FW(S) also referred to as the Sample Profile, Specimen Profile We must then separate the different contributions to specimen broadening Crystallite size and microstrain broadening of diffraction peaks Center for Materials Science and to Peak Profile1. Peak broadening due to Crystallite size2. Peak broadening due to the instrumental profile3. Which instrument to use for nanophase analysis4. Peak broadening due to microstrain the different types of microstrain Peak broadening due to solid solution inhomogeneity and due to temperature factorsCenter for Materials Science and Size Broadening Peak Width due to Crystallite size varies inversely with Crystallite size as the Crystallite size gets smaller, the peak gets broader The peak width varies with 2 as cos The Crystallite size broadening is most pronounced at large angles 2 Theta However, the instrumental profile width and microstrain broadening are also largest at large angles 2theta peak intensity is usually weakest at larger angles 2theta If Using a single peak.
6 Often get better results from Using diffraction peaks between 30 and 50 deg 2theta below 30deg 2theta, peak asymmetry compromises profile analysis() cos2 LKB=Center for Materials Science and Scherrer Constant, K The constant of proportionality, K (the Scherrer constant) depends on the how the width is determined, the shape of the crystal, and the size distribution the most common values for K are: for FWHM of spherical crystals with cubic symmetry for integral breadth of spherical crystals w/ cubic symmetry 1, because and both round up to 1 K actually varies from to For an excellent discussion of K, refer to JI Langford and AJC Wilson, Scherrer after sixty years: A survey and some new results in the determination of Crystallite size, J.
7 Appl. (1978) p102-113.() cos2 LKB=() for Materials Science and that affect K and Crystallite size analysis how the peak width is defined how Crystallite size is defined the shape of the crystal the size distributionCenter for Materials Science and (deg.)Intensity ( )Methods used in Jade to Define Peak Width Full Width at Half Maximum (FWHM) the width of the diffraction peak, in radians, at a height half-way between background and the peak maximum Integral Breadth the total area under the peak divided by the peak height the width of a rectangle having the same area and the same height as the peak requires very careful evaluation of the tails of the peak and the (deg.)
8 Intensity ( )FWHMC enter for Materials Science and Breadth Warren suggests that the Stokes and Wilson method of Using integral breadths gives an evaluation that is independent of the distribution in size and shape L is a volume average of the crystal thickness in the direction normal to the reflecting planes The Scherrer constant K can be assumed to be 1 Langford and Wilson suggest that even when Using the integral breadth, there is a Scherrer constant K that varies with the shape of the crystallites() cos2L=Center for Materials Science and methods used to determine peak width These methods are used in more the variance methods, such as Warren-Averbach analysis Most often used for dislocation and defect density analysis of metals Can also be used to determine the Crystallite size distribution Requires no overlap between neighboring diffraction peaks Variance-slope the slope of the variance of the line profile as a function of the range of integration Variance-intercept negative initial slope of the Fourier transform of the normalized line profileCenter for Materials Science and is Crystallite Size Defined Usually taken as the cube root of the volume of a Crystallite assumes that all crystallites have the same size and shape For a distribution of sizes.
9 The mean size can be defined as the mean value of the cube roots of the individual Crystallite volumes the cube root of the mean value of the volumes of the individual crystallites Scherrermethod ( Using FWHM) gives the ratio of the root-mean-fourth-power to the root-mean-square value of the thickness Stokes and Wilsonmethod ( Using integral breadth) determines the volume average of the thickness of the crystallites measured perpendicular to the reflecting plane The variance methodsgive the ratio of the total volume of the crystallites to the total area of their projection on a plane parallel to the reflecting planesCenter for Materials Science and , Crystallite Size is Different than Particle Size A particle may be made up of several different crystallites Crystallite size often matches grain size, but there are exceptionsCenter for Materials Science and Shape Though the shape of crystallites is usually irregular, we can often approximate them as.
10 Sphere, cube, tetrahedra, or octahedra parallelepipeds such as needles or plates prisms or cylinders Most applications of Scherrer analysis assume spherical Crystallite shapes If we know the average Crystallite shape from another analysis, we can select the proper value for the Scherrer constant K Anistropic peak shapes can be identified by anistropic peak broadening if the dimensions of a Crystallite are 2x * 2y * 200z, then (h00) and (0k0) peaks will be more broadened then (00l) peaks. Center for Materials Science and Size Broadening The broadening of a single diffraction peak is the product of the Crystallite dimensions in the direction perpendicular to the planes that produced the diffraction peak.