Transcription of Estimating Initial Stocking Rates - USDA
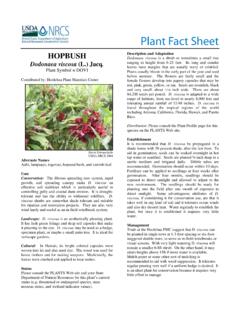
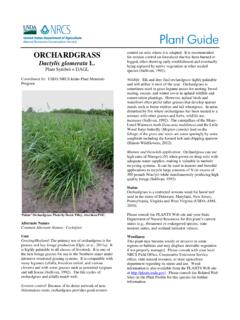
1 TECHNICAL NOTEUSDA - Natural Resources Conservation ServiceBoise, IdahoTN RANGE NO. 3 JUNE 2009 Estimating Initial Stocking Rates Dan Ogle, Plant Materials Specialist, NRCS, Boise, IDBrendan Brazee, State Rangeland Management Specialist, NRCS, Boise, IDCollecting Production Data Using ft2 Hoop, Clippers, Scale, and Cloth Bag;Photo: Brendan Brazee, NRCS, Boise, ID2 Estimating Initial Stocking Rates Dan Ogle, Plant Materials Specialist, NRCS, Boise, IDBrendan Brazee, State Rangeland Management Specialist, NRCS, Boise, IDStocking rate, defined as, the number of animals allotted to an area for a given length of time is one of the most important grazing management tools a rancher or land manager can manipulate, regardless of the grazing system, vegetation type or kind and class of livestock . Stocking rate has the largest impact on animal performance and the health of the forage resource of all of the management tools available, because it directly influences: xAnimal productivity xForage production xForage quality xSpecies composition over the long term xPlant physiology xProfitability of the operation Establishing a proper Stocking rate is critical to maintaining animal performance and optimizing forage performance while also sustaining the health of the land resource over the long term.
2 Factors that affect Stocking rate include the animal species, class of livestock (dry cow, lactating cow, bull, steer, etc.), acres available for grazing, rainfall, topography, water distribution, forage species, forage productivity including regrowth characteristics, and facilitating practices such as grazing system, irrigation and fertility program. Effective managers will balance animal performance and forage production over the long term. With this in mind, setting the appropriate Initial Stocking rate consists of determining (1) how much forage is required by the type and class of animals raised ( forage demand); (2) how much forage is produced during the year and how much is available for livestock consumption (available forage ); and (3) how long will animals be using the area (duration of grazing).
3 forage DEMAND The basis for measuring forage demand is the animal unit (AU), which is defined as the amount of forage required to maintain a 1000-pound cow with calf. Studies have established that an AU requires on average percent of the body weight in air dry forage daily (30 pounds per day for a 1000-pound cow). An animal unit month (AUM) is the average amount of dry weight forage required by a lactating 1000-pound cow and her calf for one month ( days), or pounds. Not all kinds of livestock or wildlife have the same forage demand as a 1000-pound lactating cow. In addition, forage demand varies within a species depending on its class, , its growth rate ( heifers and steers vs. mature cow), lactation and maintenance ( , dry cow vs. cow with calf). For this reason, animal unit equivalents (AUE) have been developed to assist with the approximate determination of forage demand based on the kind, class and size of animal (see Table 1).
4 3 TABLE 1 Animal Unit Equivalents (AUEs)Domestic Animal Kind-Class AUEW ildlife Animal Kind-Class AUECow dry Antelope with calf Bison mature Deer whitetail weaned Deer mule - 2 Years Elk mature ewe or ram mountain yearling Moose Sheep bighorn (ewe) mature Sheep bighorn (ram) cow herds with animals having a different average weight than the 1000 pound average used above, AUE can be adjusted ( , every 100 pounds of animal weight equates to about Animals Units thus a 1200-pound cow with a calf would be AUE or a 1600 pound bull would be AUE). Example: A land manager needs to determine how much pasture he will need to acquire prior to implementing a brush management project which will require him to defer grazing from June 1stthrough October 30th this year.
5 The herd consists of 300 pair of 1100 lbs Angus cross cattle with 15 Angus bulls during July and August. Calculation:#Head x AUE x Time in months = AUM s 300 Cow/calf pairs x AUE x 5 months = 1650 AUM s 15 Bulls x AUE x 2 months = 38 AUM s The manager will need to find a forage supply that will provide approximately 1700 AUM s for the deferment period. forage PRODUCTION The next step in Estimating Initial Stocking rate is to determine the amount of forage being produced. The local climate (temperature and precipitation), soil (texture depth fertility) and current vegetation management largely affect total forage production for an area. Total production of forage can be estimated by using simple clipping procedures and converting the green weight estimates to present reconstructed weights.
6 You will need a frame of a known area (Table 2), clippers, paper bags and a scale that measures in grams. Additional information will be needed for reconstruction including degree of use, knowledge of growth curves, and familiarity with typical or normal growing season climate variables. Detailed information on how to collect plant production data can be found in the National Range and Pasture Handbook, Chapter 4 ( )and the Monitoring Manual for Grassland, Shrubland, and Savanna Ecosystems, Volume II Chapter 9 ( )4 TABLE 2 Range Hoop and Square SubplotDimensions and Conversion ft2 Radius = feet Hoop Circumference = feet Square Plot Dimensions = X ft Conversion Factor = Grams X 10 = lbs/ac =Grams X = ft2 Radius = feet Hoop Circumference = feet Square Plot Dimensions = X ft Conversion Factor = Grams X 20 = lbs/ac = Grams X = ft2 Radius = feet Hoop Circumference = feet Square Plot Dimensions = X ft Conversion Factor = Grams X 40 = lbs/ac = Grams X = kg/ha m2 Radius = meter Hoop Circumference = meters Square Plot Dimensions = X meter Conversion Factor = Grams X 10 = kg/ha = Grams X = lbs/ac m2 Radius = meter Hoop Circumference = meters Square Plot Dimensions = X meter Conversion Factor = Grams X 20 = kg/ha = Grams X = lbs/ac
7 M2 Radius = meter Hoop Circumference = meters Square Plot Dimensions = X meter Conversion Factor = Grams X 40 = kg/ha = Grams X = lbs/ac The size of subplot to use depends on the nature of the area being sampled. forage production varies between and within pastures and rangeland areas, so efforts to estimate total production should attempt to represent this variation as much as possible. Sites such as pastures that are uniformly vegetated with few species and consistent cover can be adequately sampled with smaller subplots ( , ft2). Rangeland ecological sites that have many species and/or are sparsely vegetated require larger subplots (example ft2) to capture and reflect variation in site. It is recommended to sample at least 10 subplots. Collecting data for additional subplots can also increase the accuracy of the estimates.
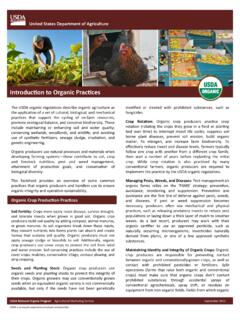
8 Collecting Yield Data at Coffee Point Test Site North of Aberdeen, Idaho; Photo: Loren St. John, NRCS, Aberdeen, ID 5 DATA COLLECTION FOR Estimating forage PRODUCTION Step 1: Determine Sample Area The area to be sampled should be representative of the grazing unit. The subplots should be located with in the same Ecological Site on rangeland or in areas of similar growth and production potential within pasture systems. Step 2: Determine Correction Factor for Clipped/Estimated green weights Select at least two of the ten subplots to collect clipped data. These subplots should contain a majority of the species found in the sampling area. The clipped weight for each species is then divided by the estimated weight for the clipped subplots. The resulting factor is used to adjust green weight estimates based upon actual weights.
9 For example, the data collector clipped Idaho fescue in subplots 3 and 7 Estimating 15 grams green weight. The clipped weight for the two plots was 17 grams. The correction factor can be multiplied by the average green weight of the ten subplots to determine the corrected green grams = , x 124 lbs/ac = lbs/ac corrected green weight. See ID-CPA-006 in Appendix 3: Determine Percent Dry Weight The corrected green weight can be converted to dry weights using estimated dry matter ranges from Table 3 Green Weight to Dry Weight Conversion. Appendix A -Dry Weight Percent of Selected grasses , Grasslikes, Forbs, Shrubs, and Trees for Idaho provides a more accurate conversion for most common range species. TABLE 3 Green Weight to Dry Weight ConversionsNative Range (Green Wt x Percent = Air Dry Weight)
10 % Dry % Dry Deciduous % Dry grasses Matter ForbsMatterShrubsMatterPre-Boot25-35%Pre -Bloom 15-25%New Foliage 25-40%Full-Bloom35-45%Full-Bloom25-35%Ma ture Foliage 40-55% Soft-Dough 45-55% Soft-Dough 35-45% Evergreen % Dry Hard-Dough55-60%Hard-Dough45-55%ShrubsMa tter Seed-Ripe 60-70% Seed-Ripe 55-65% New Foliage 35-55% Drying 70-95% Drying 65-95% Mature Foliage 55-70% Seeded Pasture (Green Wt x Percent = Air Dry Weight) %Dry % Dry grasses Matter Forbs/Legumes Matter Pre-Boot20-35% Pre-Bloom 15-25%Full-Bloom35-45% Full-Bloom 25-35%Soft-Dough45-55% Soft-Dough 35-45% Hard-Dough55-60% Hard-Dough 45-55% Seed Ripe 60-70% Seed Ripe 55-65% Drying 70-95% Drying 65-95% 6 Step 4: Determine Percent Growth Ungrazed This is the average percent ungrazed by species for the sample area.