Transcription of ETERMINING WITHDRAWAL RATES USING HISTORICAL DATA
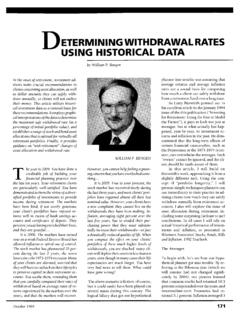
1 ETERMINING WITHDRAWAL RATES USING HISTORICAL DATA by William P. Bengen At the onset of retirement, investment ad- visors make crucial recommendations to clients concerning asset allocation, as well as dollar amounts they can safely with- draw annually, so clients will not outlive their money. This article utilizes histori- cal investment data as a rational basis for these recommendations. It employs graphi- cal interpretations of the data to determine the maximum safe WITHDRAWAL rate (as a percentage of initial portfolio value), and establishes a range of stock and bond asset allocations that is optimal for virtually all retirement portfolios. Finally, it provides guidance on "mid-retirement" changes of asset allocation and WITHDRAWAL rate.
2 T he year is 2004. You have done a creditable job of building your financial planning practice over the last ten years. Your retirement clients are particularly well-satisfied. You have demonstrated to them the virtue of a diver- sified portfolio of investments to provide income during retirement. The markets have been kind, if not overly generous; your client's portfolios have enjoyed re- turns well in excess of bank savings ac- counts and certificates of deposit. They perceive you as having enriched their lives, and they are grateful .. It is 2006. The markets have turned sour as a weak Federal Reserve Board has allowed inflation to spiral out of control.
3 The stock market has plummeted 35 per- cent during the last 2 years, the worst losses since the 19 73-19 74 recession. Many of your clients are alarmed, worried that they will have to cut back on their lifestyles to preserve capital in their retirement ac- counts. You soothe them, reminding them that you carefully computed their RATES of WITHDRAWAL based on average RATES of re- turns experienced by the markets over the years, and that the markets will recover. WILLIAM P. BENGEN However, you cannot help feeling a gnaw- in g c oncern that y ou hav e ov erloo ked some- thing .. It is 2009. True to your forecast, the stock market has recovered nicely during the last three years, and most clients'port- folios have regained almost all their lost nominal value.
4 However, your clients have a new complaint: they cannot live on the withdrawals they have been making. In- flation, averaging eight percent over the last five years, has so eroded their pur- chasing power that they must substan- tially increase their withdrawalsmor face a drastically reduced quality of life. When you compute the effect on your clients' portfolios of these much higher levels of withdrawals, you are shocked: many cli- ents will deplete their assets in less than ten years, even though in many cases their life expectancies are much longer. You have very bad news to tell them. What could have gone wrong? The above scenario is fiction, of course, but it could easily have been played out several times during this century.
5 The logical fallacy that got our hypothetical planner into trouble was assuming that average returns and average inflation RATES are a sound basis for computing how much a client can safely withdraw from a retirement fund over a long time. As Larry Bierwirth pointed out in his excellent article in the January 1994 issue of the this publication ("Investing for Retirement: USING the Past to Model the Future"), it pays to look not just at averages, but at what actually has hap- pened, year-by-year, to investment re- turns and inflation in the past. He dem- onstrated that the long-term effects of certain financial catastrophes, such as the Depression or the 1973-1974 reces- sion, can overwhelm the averages.
6 Such "events" cannot be ignored, and the cli- ent should be made aware of them. In this article, I will build on Bierwirth's work, approaching it from a slightly different tack. USING the con- cept of "portfolio longevity," I will present simple techniques planners can use immediately in their practice in ad- vising clients how much they can safely withdraw annually from retirement ac- counts. I also will explore the issue of asset allocation during retirement, in- cluding some surprising (at least to me) conclusions. In all cases I will rely on actual HISTORICAL performance of invest- ments and inflation, as presented in Ibbotson Associates' Stocks,, Bonds, Bills and Inflation: 1992 Yearbook.
7 The Averages To begin with, let's see how our hypo- thetical planner got into trouble. By re- ferring to the Ibbotson data (which we will assume had not changed signifi- cantly by 2004), our planner learned that common stocks had returned percent compounded over the years, and intermediate-term Treasuries had re- turned percent. Inflation averaged 3 October 1994171 percent over the same period. There- fore, a client with a portfolio consisting of 60-percent stocks and 40-percent bonds could expect an average com- pounded return of percent, assum- ing continual rebalancing. The "real" return, adjusted for inflation, would be almost percent.
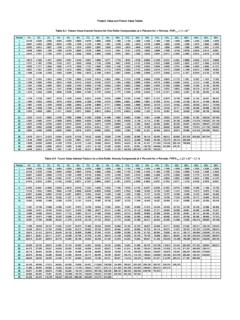
8 This planner's clients wanted to spend as much as possible each year from their retirement accounts, while maintaining a consistent lifestyle throughout retirement. Given the above analysis, it seemed to the planner that the clients could safely withdraw all the "real return" each year, or about five percent, and leave the remainder in the portfolio. The clients could thus increase turns and inflation stayed close to his- torical averages. The circumstance that upset the arrangement was an "event," consisting of a severe stock-market downturn and high inflation. What similar events have actually occurred in the past? The Events Table 1 lists the three largest stock- market declines since 1926 that have occurred over periods of more than one year.
9 (The "crash" of 1987 does not appear, as stocks showed a gain for the full year.) Because of my interest in astronomy, I have nicknamed them, re- spectively, the "Big Bang," the "Big Dip- Assuming a minimum requirement of 30 years of portfolio longevity, a first-year WITHDRAWAL of 4 percent, followed by inflation-adjusted withdrawals in subsequent years, should be safe. their withdrawals each year by three percent, keeping pace with inflation. At the same time, the value of their portfo- lios would increase with inflation, satis- fying their secondary goal of leaving wealth for their heirs. Thus, the planner recommended that his clients withdraw five percent of their portfolio's initial value at the end of the first year, and annually increase their withdrawals by three percent, the antici- pated rate of inflation.
10 This plan worked well for several years, as investment re- per," and the "Little Dipper," reflecting their relative impact on the value and purchasing power of investors' portfo- lios. These impacts will be more pre- cisely quantified in the section below on The Portfolios. a The "Big Bang" of the 1973-74 recession was the most devastating be- cause it occurred during a period of high inflation. Not only did investors suffer large paper losses in their portfolios, but the purchasing power of what remained was reduced substantially. It was a fright- 172 ening period for investors. a The "Big Dipper" of 1937-1941 featured a stock decline almost as great as the "Big Bang," but it occurred during a period of moderate inflation and some- what higher bond returns.