Transcription of ethylene octene polyolefin copolymer …
1 1 Spectra Analysis, Inc. 257 Simarano Drive, Marlborough, MA 01752 Tel: + Fax: + Email: LC-IR Characterization of Polyolefins The DiscovIR-LC is a powerful new tool for materials analysis. When connected to the outlet of a LC column, the DiscovIR deposits LC eluants as a continuous solvent-free track on an infrared transparent substrate. The built-in interferometer simultaneously captures a set of time-ordered infrared spectra from the deposited track. Sample data collection and data processing are executed by GRAMS AITM software resident on the DiscovIR system. When analyzing polymers the chromatographic eluant deposits as a continuous track of sample, ranging from high molecular weight to low. This resultant map of molecular structure of all regions of a polymer GPC separation enables characterization of the distribution of the sample comonomers. SUMMARY A set of Dow Engage polyolefin elastomer samples ( ethylene / octene copolymers) were analyzed by combined Gel Permeation Chromatography (GPC) and Fourier Transform Infrared Spectroscopy (FTIR).
2 The sample set included EngageTM 8100, 8200, 8401, 8540 and ENR6386 ( ethylene /propylene). The object of the analysis was to evaluate the relative copolymer content across the MWD. GPC eluant was directed to a Spectra Analysis DiscovIR instrument, and the polymer eluant deposited as a track on an IR transparent disk. Spectra were captured and processed as a time-ordered set of spectra, from which functional group chromatograms were extracted. Backbone (methylene) and branch (methyl) chromatograms were obtained and used to generate peak area absorbance ratio plots for the absorbance bands at approximately 1375 and 1465 cm-1 wavenumbers. The ratio of these IR absorbance bands reflects the ratio of methyl groups to methylene groups. An increase in the relative area for the 1375 cm-1 wavenumber absorbance band indicates an increase in the octene content of the copolymer . Differences in the copolymer content are evident between the samples with the order of increasing octene content being 8540<8401<8200, 8100.
3 The ratio plots show the Engage 8100 and 8200 samples to have essentially the same octene content. A sample of a polyethylene homopolymer was included in the analysis for comparison. The Engage 8200 and Engage 8401 exhibited compositional drift, the branch methyl contents trending downward with increased elution time ( decreasing molecular weight). DiscovIR-LC Deposition and Detection System TM Application Note 032 November 2009 2 Spectra Analysis, Inc. 257 Simarano Drive, Marlborough, MA 01752 Tel: + Fax: + Email: The ability of the DiscovIR to obtain good quality IR spectra without the interference of mobile phase solvent absorbance bands and to detect compositional differences in the Engage polyolefin elastomers has been clearly demonstrated. INTRODUCTION Infrared Polyolefins Applications Described here are some of the useful measurements of polyolefins that can be obtained by the use of LC-IR analysis. Infrared (IR) spectroscopy is one of the most often used spectroscopic tools for the study of polymers.
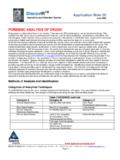
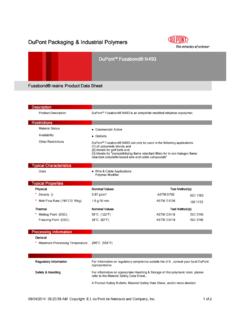
4 1 polyolefin spectra (Figure 1) are dominated by methylene bands (PE) and methyl + methylene bands (PP). At first glance, the spectra of polyolefins appear to provide sparse information. Lower intensity bands however can provide a wealth of information related to structure, composition, configuration and stereo regularity. Useful bands are found over the full range (4000 600 cm-1) of the mid-infrared spectrum. By combining various chromatographic modes with IR spectral acquisition a wealth of information can be extracted from polymer samples. 3500 3000 2500 2000 1500 1000 Absorbance / Wavenumber (cm-1) 3500 3000 2500 2000 1500 1000 Absorbance / Wavenumber (cm-1) Polyethylene Polypropylene Figure 1 FTIR spectra of polyethylene and polypropylene Identification of polyolefin types A concise but comprehensive description of the infrared analysis of polyethylene is provided by Nishikida and Coates2.
5 They describe the spectral characteristics that can be used to differentiate between low density (LDPE), linear low density (LLDPE), and high density (HDPE) polyethylenes. They also describe the IR identification of the -olefins employed in production of low density polyethylenes, and the determination of crystallinity and density, Short Chain Branching Polyolefins are produced in many forms of copolymers and blends. LLDPE is a copolymer of ethylene with a comonomer that provides short chain branches that disrupt crystallinity of the methylene backbone. This results in modified physical properties, such as lower melting point, lower modulus, and increased pliability. 1 Spectroscopy of Polymers, Koenig, Jack L, 1999 Elsevier 2 Nishikeda and Coates, Chapter 4, Handbook of Plastic Analysis, Hubert Lobo and Jose Bonilla, 3 Spectra Analysis, Inc. 257 Simarano Drive, Marlborough, MA 01752 Tel: + Fax: + Email: Identification and distribution of various polyolefin short chain branches is a frequent application, as reported by Harvey and Ketly3.
6 Blitz and McFaddin similarly described useful absorption bands for short chain branching (SCB)4. Traditional methodologies, using the methyl deformation band for qualitative and quantitative analyses, have recognized shortcomings. The methyl and methylene rocking bands, which are more characteristic of short chain branch type, were found to be more useful. Methyl, ethyl, butyl, isobutyl, and hexyl branches are qualitatively and quantitatively characterized in LLDPE copolymers by FTIR spectroscopy..Fourier self-deconvolution was used to resolve overlapping bands for ethyl, butyl, and isobutyl branches. Using calibrations derived for LLDPE copolymers from 13C NMR data, FTIR spectroscopy was also used to characterize LLDPE terpolymers and LDPE resins. The FTIR and NMR data are in qualitative and quantitative agreement. In some cases correction were made to the FTIR results using data obtained from the methyl deformation band. The FTIR technique is less costly and faster than NMR spectroscopy.
7 Branch type Wavenumber, cm-1 (Harvey and Ketly) Wavenumber, cm-1 (Blitz and McFaddin) methyl (branch) 935 ethyl (branch) 770 propyl (terminal) 740 propyl (branch) 735 n-butyl (branch) 724 893 Isobutyl (branch) 920 n-pentyl (branch) 723 n-hexyl (branch) 722 888 Table 1 Absorbance bands of different branch types Additives Analysis Commercial polyolefin resins contain various additives (antioxidants, UV stabilizers, colorants, fillers). The soluble additives will elute as a non-resolved peak at the end of a GPC separation. Collection of this fraction and subsequent analysis by Absorption Chromatography FTIR provides a rapid identification of multiple components. Alternatively a polymer sample may be extracted, and the extract then analyzed by (reverse phase) HPLC-FTIR via the DiscovIR LC. Tacticity and Crystallinity The regularity of the macromolecular structure influences the degree to which it has rigid, crystalline long range order or flexible, amorphous long range disorder.
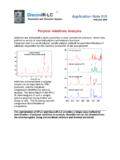
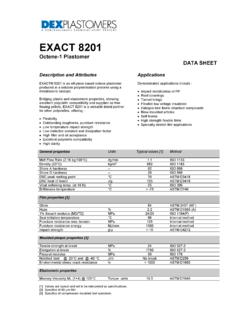
8 Polymers with a high degree of tacticity manifest crystallinity, while low tacticity (atactic) polymers, at low temperatures solidify into a vitreous glassy state. Infrared spectroscopy is frequently used as a simple and fast method for determining the level of tacticity in stereoregular 3 The Infrared Identification Of Short-Chain Branches In Polyolefins, Harvey , , J App Pol Sci, V5 Issue 15, pp 247-250 4 The Characterization Of Short Chain Branching In Polyethylene Using Fourier Transform Infrared Spectroscopy, Blitz J P, Mcfaddin D, Pol. Sci. Vol 51 Issue 1 pp 13-20 5 Polyolefins: processing, structure and properties, James L White, David Choi, p26 4 Spectra Analysis, Inc. 257 Simarano Drive, Marlborough, MA 01752 Tel: + Fax: + Email: 1500 1400 1300 1200 1100 1000 900 800 700 Absorbance / Wavenumber (cm-1)14731464731719 High Tacticity Polyethylene (HDPE) Figure 2 Peak splitting of crystalline polyethylene Crystallinity of polyethylene manifests itself as peak splitting (Figure 2) of the 1,464 and 719 cm-1 peaks, with additional peaks found at 1,473 and 731 cm-1.
9 The crystallinity of a polyethylene sample can be determined from the ratio of the 731 to 719 cm-1 peaks6. ethylene Propylene Copolymers and Blends This commercially important group of polymers can readily be characterized by the hyphenated technique of GPC-FTIR. The methyl content of the polymer is readily determined by FTIR and can provide a measure of the propyl content of the polymer, provided one accounts for methyl-containing terminal groups. Copolymerization of ethylene and propylene results in long sequences such as P-E-E-P, P-E-P. The random copolymerization of ethylene and propylene result in a triad of absorbance bands in the 700 - 800 cm-1 region. Deconvolution of this region will yield a triad of peaks. In a random EP copolymer , the ethylene -propylene ratio can be determined from the intensity ratio of the (deconvolved) peaks at 722, 736, and 751 cm-1. 3 Crosslinking of EP rubbers is achieved by adding a diene as a comonomer. The diene content in EPDM is customarily less than 10%.
10 Infrared diene bands are weak, but usable in predicting crosslinking results. TPO (Thermo Plastic Olefin) properties are sensitive to changes in molecular weight distribution and composition variation. These polymers have been shown to have superior processing and/or better curing than comparable polymers of the same average composition but without the bimodal molecular weight/composition distribution 7. 6 American Society for Testing and Materials D5576. 7 Datta,S. and Kresge, , US Patent No. 4,722,971, Feb 2, (1988) 5 Spectra Analysis, Inc. 257 Simarano Drive, Marlborough, MA 01752 Tel: + Fax: + Email: Polymer Degradation Analysis Methods exist for infrared analysis of the degradation products of polyolefins. The various oxidation groups (ROOH, ROH, primary, secondary, tertiary), when derivitized, yield sets of unique, discrete infrared bands that characterize the oxidation entities and degradation The kinetics of photodegradation is coupled with the consumption of protectant additives (also identifiable via LC-IR methodology)9.