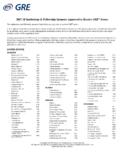
Transcription of ETS Proficiency Profile Abbreviated Reports
1 STANDARD Reports FOR THE. Abbreviated FORM OF THE. ETS Proficiency Profile TEST. P&S DMS 710. ETS Proficiency Profile Individual Student Score report Scores for: Student Test Date: 9/6/2006. Number: 123456789 Form Code: 4 BMA1-A1P. Institution: ETS University Cohort Name: Entering Freshmen 2006. Total Score: 493. Overall SEM*: This report provides your total test score on your ETS Proficiency Profile test. Scores can range from 400 to 500. * SEM is the Standard Error of Measurement that reflects the inherent error that is a part of any testing process. Each SEM provided is based upon a large sample of test takers. Subtracting the SEM from your score twice to obtain a minimum and then adding the SEM to your score twice to obtain a maximum will provide a range of scores. If you were to take any number of tests equivalent to this one, your score would fall within this range with a statistical confidence level of 95%.
2 For example, if the given SEM for a score was , and the achieved score was 450, then 450 minus 5. equals 445 and 450 plus 5 equals 455 (where 5 is equal to times 2). This means that 95% of the time if you took a test that was equivalent to the test that you just took you would score within the range of 445. to 455. To compare your score with the current national comparative data, go to the ETS Proficiency Profile Comparative Data Guide on the web at ETS Proficiency Profile Summary of Scaled Scores To show the ability of the group taking the test ETS University Cohort Name: Entering Freshmen Fall 2006. Abbreviated Close Date: 09/06/2006. Test Description: Abbreviated Form A Online Student Level: Entering Freshmen Number of students tested: 1681. Number of students included in these statistics: 1677.
3 Number of students excluded (see roster): 4. th th th Possible Range Mean Score 95% Confidence Limits* for Mean Standard Deviation 25 Percentile 50 Percentile 75 Percentile Total Score 400 to 500 443 to 448 435 444 456. Skills Subscores: Critical Thinking 100 to 130 112 to 114 108 113 116. Reading 100 to 130 118 to 121 115 113 124. Writing 100 to 130 113 to 115 112 114 117. Mathematics 100 to 130 111 to 114 108 112 116. Context-Based Subscores: Humanities 100 to 130 114 to 117 111 115 120. Social Sciences 100 to 130 113 to 116 111 114 119. Natural Sciences 100 to 130 115 TO 118 113 117 121. *The confidence limits are based on the assumption that the questions contributing to each scaled score are a sample from a much larger set of possible questions that could have been used to measure those same skills.
4 If the group of students taking the test is a sample from some larger population of students eligible to be tested, the confidence limits include both sampling of students and sampling of questions as factors that could cause the mean score to vary. The confidence limits indicate the precision of the mean score of the students actually tested, as an estimate of the "true population mean" the mean score that would result if all the students in the population could somehow be tested with all possible questions. These confidence limits were computed by a procedure that has a 95 percent probability of producing upper and lower limits that will surround the true population mean. The population size used in the calculation of the confidence limits for the mean scores in this report is 797. Important Notice: Statistics computed for small numbers of students ( , 25 or fewer) may not generalize to other, similar groups of students.
5 The smaller the number of students included in the statistics, the less likely that another group of students would have performed similarly. ETS Proficiency Profile Roster of Scaled Scores To show the scaled scores of individual students ETS University Cohort Name: Entering Freshmen Fall 2006. Abbreviated Close Date: 09/06/2006. Test Description: Abbreviated Form A Online Student Level: Entering Freshmen Student Name Student ID Number Total Score Student 22144286 431. Student 11932090 421. Student 34522186 464. Student 64911930 459.. Student 12022270 438. Student 63412627 440. Student 12095970 469. Student 12692627 427. * Indicates a student who answered fewer than 75% of the questions. These students are not included in any statistical analysis. ETS Proficiency Profile Summary of Proficiency Classifications To show how many students are proficient at each level ETS University Cohort Name: Entering Freshmen Fall 2006.
6 Abbreviated Close Date: 09/06/2006. Test Description: Abbreviated Form A Online Student Level: Entering Freshmen Number of students tested: 1681. Number of students included in these statistics: 1677. Number of students excluded (see roster): 4. *The skills measured by the ETS Proficiency Profile test are grouped into Proficiency levels three Proficiency levels for writing, three for mathematics and three for the combined set of skills involved in reading and critical thinking. The table and graph show the number and percentage of students who are proficient, marginal, and not proficient at each Proficiency level in reading and critical thinking, writing, and mathematics. A student classified as marginal is one whose test results do not provide enough evidence to classify the student either as proficient or as not proficient.
7 See the User's Guide for more information about these classifications, including a list of the specific skills associated with each Proficiency level in each skill area. Important Notice: Statistics computed for small numbers of students ( , 25 or fewer) may not generalize to other, similar groups of students. The smaller the number of students included in the statistics, the less likely that another group of students would have performed similarly. ETS Proficiency Profile Scaled Score Distributions Academic Area Subscores ETS University Cohort Name: Entering Freshmen Fall 2006. Abbreviated Close Date: 09/06/2006. Test Description: Abbreviated Form A Online Student Level: Entering Freshmen Number of students tested: 1681. Number of students included in these statistics: 1677. Number of students excluded (see roster): 4.
8 ETS Proficiency Profile Scaled Score Distributions Skills Subscores ETS University Cohort Name: Entering Freshmen Fall 2006. Abbreviated Close Date: 09/06/2006. Test Description: Abbreviated Form A Online Student Level: Entering Freshmen Number of students tested: 1681. Number of students included in these statistics: 1677. Number of students excluded (see roster): 4. ETS Proficiency Profile Scaled Score Distributions Total ETS University Cohort Name: Entering Freshmen Fall 2006. Abbreviated Close Date: 09/06/2006. Test Description: Abbreviated Form A Online Student Level: Entering Freshmen Number of students tested: 1681. Number of students included in these statistics: 1677. Number of students excluded (see roster): 4. ETS Proficiency Profile Other Information Questions report Are you going on to graduate school (A), the workforce (B), or still undecided (C)?
9 ETS University Cohort Name: Entering Freshmen Fall 2006. Abbreviated Close Date: 09/06/2006. Test Description: Abbreviated Form A Online Number of students tested: 1681. Number of students included in these statistics: 1677. Number of students excluded (see roster): 4. Number Total Score Critical Thinking Reading Writing Mathematics Humanities Social Sciences Natural Sciences Total Group 1677. ( ) ( ) ( ) ( ) ( ) ( ) ( ) ( ). Option A 756. ( ) ( ) ( ) ( ) ( ) ( ) ( ) ( ). Option B 412. ( ) ( ) ( ) ( ) ( ) ( ) ( ) ( ). Option C 509. ( ) ( ) ( ) ( ) ( ) ( ) ( ) ( ). 0 0 0 0 0 0 0 0. Option D 0. ( ) ( ) ( ) ( ) ( ) ( ) ( ) ( ). 0 0 0 0 0 0 0 0. Option E 0. ( ) ( ) ( ) ( ) ( ) ( ) ( ) ( ). 0 0 0 0 0 0 0 0. Option F 0. ( ) ( ) ( ) ( ) ( ) ( ) ( ) ( ). 0 0 0 0 0 0 0 0. Option G 0. ( ) ( ) ( ) ( ) ( ) ( ) ( ) ( ).
10 Option H 0. ( ) ( ) ( ) ( ) ( ) ( ) ( ) ( ). No response 0. ( ) ( ) ( ) ( ) ( ) ( ) ( ) ( ). The mean score is presented on the top of each cell, with the standard deviation below in parentheses. ETS Proficiency Profile Additional Institution Questions report ETS University Cohort Name: Entering Freshmen Fall 2006. Abbreviated Close Date: 09/06/2006. Test Description: Abbreviated Form A Online Number of students tested: 1681. Number of students included in these statistics: 1677. Number of students excluded (see roster): 4. 0 1 2 3 4 5 6 7 8 9 Total Question 1014 0 0 0 0 0 0 0 0 0. 1 1014. (100%) (0%) (0%) (0%) (0%) (0%) (0%) (0%) (0%) (0%). 1014 0 0 0 0 0 0 0 0 0. 2 1014. (100%) (0%) (0%) (0%) (0%) (0%) (0%) (0%) (0%) (0%). 1011 0 0 0 0 0 0 0 0 0. 3 1014. (100%) (0%) (0%) (0%) (0%) (0%) (0%) (0%) (0%) (0%).
