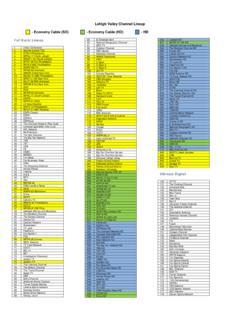
Transcription of EU 28 apple production by country - wapa-association.org
1 EUROPEAN apple FORECAST 2018. EU 28 apple production by country EU 28. apple production by country x 1000 tons country 2009 2010 2011 2012 2013 2014 2015 2016 2017 F2018 (1) (2). Austria 185 169 199 157 155 188 177 40 67 184 175 94. Belgium 344 288 305 220 220 318 285 234 88 217 147 7. Croatia 60 89 83 59 96 62 101 35 66 108 64 60. Czech Rep 145 103 79 118 121 131 156 139 102 150 47 13. Denmark 24 21 20 18 23 26 24 24 19 24 26 7. France 5 -2. Germany 835 953 972 804 973 597 990 66 14. Greece 224 254 305 242 236 245 242 259 231 286 24 17. Hungary 514 488 301 750 585 920 522 498 530 728 37 41. Italy 29 5. Latvia 13 12 8 9 15 10 8 10 8 6 -25 -31. Lithuania 74 46 49 39 40 27 46 50 48 54 13 13. Netherlands 402 334 418 281 314 353 336 317 228 259 14 -12.
2 Poland 56 23. Portugal 274 251 265 221 284 272 329 263 314 267 -15 -12. Romania 379 423 412 351 387 382 336 327 230 320 39 8. Slovakia 48 32 33 36 42 46 40 17 15 47 213 96. Slovenia 64 66 73 45 56 68 71 12 6 65 983 119. Spain 470 486 507 391 464 505 482 495 480 473 -1 -3. Sweden 18 20 17 14 17 16 21 20 18 32 78 63. UK 212 214 226 162 204 223 243 244 206 220 7 -5. Total: 36 13. (1) Percentage difference between F2018 and 2017. (2) Percentage difference between F2018 and the average of 2017 - 2016 - 2015. EU apple production 14000. 12000. 10000. 8000. 6000. 4000. 2000. 0. 2009. 2010. 2011. 2012. 2013. 2014. 2015. 2016. 2017. F2018. EU 28 apple production by variety S EU 28s apple production by variety x 1000 tons Variety 2009 2010 2011 2012 2013 2014 2015 2016 2017 F2018 (1) (2).
3 Annurca 35 34 35 35 35 40 35 35 35 40 14 14. Boskoop 82 60 73 58 58 85 77 71 34 63 86 4. Braeburn 338 289 324 264 302 322 327 320 220 305 38 5. Bramley 95 95 91 59 70 83 84 85 75 77 3 -5. Cortland 80 50 70 40 25 25 26. Cox Orange 65 89 89 38 42 33 34 29 20 20 -4 -30. Cripps Pink 162 160 184 144 187 249 244 261 260 277 7 9. Elstar 488 362 453 353 346 431 399 387 265 335 26 -4. Fuji 245 251 261 212 311 321 338 288 290 327 13 7. Gala 989 15 10. Gloster 114 112 148 187 196 201 183 197 166 187 13 3. Golden Delicious 23 3. Granny Smith 343 342 413 302 361 383 405 384 363 381 5 -1. Idared 828 619 692 986 965 629 83 27. Jonagold 742 544 652 475 500 644 633 567 298 539 81 8. Jonagored 204 180 194 367 341 491 519 539 335 545 63 17.
4 Jonathan 305 282 242 201 178 193 143 123 108 150 39 20. Lobo 100 60 100 50 30 30 31. Morgendurf/imper 67 81 61 53 57 74 46 49 54 59 10 20. Pinova 35 27 37 43 62 79 119 104 85 138 63 34. Red Delicious 724 663 680 541 597 675 643 632 558 692 24 13. Red Jonaprince 38 29 33 48 53 98 104 156 114 353 210 183. Reinette Grise du 99 101 108 73 121 126 134 108 83 130 56 20. Shampion 323 257 327 423 457 494 513 522 416 571 37 18. Spartan 8 6 6 6 6 6 6 4 3 4 29 -3. Stayman 16 18 17 12 18 14 14 14 8 7 -7 -39. Other new 108 134 152 100 152 168 207 211 208 307 48 47. Other 51 16. Ligol 250 260 290 303 330 250 350 40 19. Total: 36 13. (1) Percentage difference between F2018 and 2017. (2) Percentage difference between F2018 and the average of 2017 - 2016 - 2015.
5 (3) Other new varieties: Ariane, Belgica, Cameo, Diwa, Greenstar, Honey Crunch, Jazz, Junami, Kanzi, Mariac, Rubens, Tentation, Wellant,.. EUROPEAN PEAR FORECAST 2018. EU 28 pear production by country EU 28. Pear production by country x 1000 tons country 2009 2010 2011 2012 2013 2014 2015 2016 2017 F2018 (1) (2). Belgium 307 285 295 236 315 374 369 322 310 318 2 -5. Croatia 5 6 6 2 3 2 2 1 6 7 27 156. Czech Rep 6 3 3 6 7 4 10 7 4 11 165 55. Denmark 7 6 5 5 6 6 6 6 5 6 20 6. France 202 164 176 124 154 131 155 138 133 135 2 -5. Germany 52 39 47 34 34 45 43 35 23 31 35 -8. Greece 43 54 36 42 32 37 60 47 59 57 -4 2. Hungary 40 36 21 25 36 40 33 38 35 38 10 9. Italy 858 680 934 650 726 736 764 681 738 741 0 2.
6 Latvia 0 0 0 0 0 1 0 0 0 0 -30 -28. Netherlands 301 274 336 199 327 349 349 374 330 398 21 13. Poland 90 40 55 45 65 50 80 55 40 70 75 20. Portugal 198 172 210 115 162 203 134 113 186 158 -15 9. Romania 24 20 28 19 24 17 13 16 12 17 37 19. Slovakia 1 1 1 0 1 0 1 0 1 1 52 84. Slovenia 6 6 4 3 3 4 4 1 0 4 137. Spain 429 456 461 355 403 400 344 311 331 311 -6 -5. Sweden 2 1 2 1 1 1 1 1 1 2 150 150. UK 31 33 32 28 26 25 25 27 25 21 -15 -16. Total: 4 3. (1) Percentage difference between F2018 and 2017. (2) Percentage difference between F2018 and the average of 2015- 2016- 2017. EU pear production 3000. 2500. 2000. 1500. 1000. 500. 0. 2008. 2009. 2010. 2011. 2012. 2013. 2014. 2015. 2016. 2017. F2018.
7 EU 28 pear production by variety EU 28. Pear production by variety x 1000 tons Variety 2009 2010 2011 2012 2013 2014 2015 2016 2017 F2018 (1) (2). Abate F 306 224 404 256 304 358 333 296 328 333 2 5. Blanquilla 86 81 78 59 54 49 44 40 43 41 -4 -2. Conference 903 832 928 693 894 952 967 910 873 953 9 4. Coscia-Ercollini 106 98 80 77 80 66 79 67 79 70 -12 -7. Doyenne du Comice 116 97 107 58 83 94 87 81 59 74 26 -2. Durondeau 8 6 7 5 6 6 5 3 2 3 21 -18. Guyot 102 92 96 70 80 67 74 59 65 58 -11 -11. Kaiser 65 42 60 39 54 33 45 38 43 45 5 7. Passacrassana 19 15 17 17 14 11 12 11 9 9 1 -14. Rocha 197 171 209 115 162 203 134 113 186 158 -15 9. William BC 312 286 332 252 283 278 283 261 263 267 1 -1.
8 Other 382 331 333 246 315 309 330 293 287 314 9 4. Total: 4 3. (1) Percentage difference between F2018 and 2017. (2) Percentage difference between F2018 and the average of 2015- 2016- 2017. Top 1 variety - Conference Top 3 varieties of pear production after Conference 1000 400. 2015. 950 300. 2016. 900 200. 2017. 850 100. F2018. 800 0. 2015 2016 2017 F2018 Abate F William BC.