Transcription of EU study on company car taxation - OECD.org
1 european commission taxation and Customs Union Pr sentation Powerpoint EU study on company car taxation : presentation of the main results Presentation in the OECD workshop on estimating support to fossil fuels, Paris 18-19 November 2010 Katri Kosonen european commission , DG TAXUD european commission / taxation and Customs Union Pr sentation Powerpoint The study The study was carried out for the commission by Copenhagen Economics in 2009, the final report is published as a taxation Paper of DG TAXUD: The purposes to carry out the study were the following.
2 Collect information on the tax treatment of company cars in the EU Member States Examine the extent to which the MSs subsidise the use of company cars through their tax systems Analyse potential fiscal, welfare and environmental implications of such favourable tax treatment Generally to increase information and raise awareness in the Member States on a potentially important tax policy issues, but not to prepare any policy initiative at the EU level european commission / taxation and Customs Union Pr sentation Powerpoint Scope The study deals mainly with the taxation of fringe benefits related to the use company cars at the employee level, and not with the taxation at company level (depreciation rules, VAT) It covers a large part of the EU Member States (18)
3 And calculates subsidy levels for those 18 EU MSs main contribution In assessing the behavioural effects of tax treatment it applies the same methodology as two Dutch studies (Puigarnau van Ommeren 2007, 2009) and generalizes it to the EU level These results are based on heroic assumptions should be taken as indicative only european commission / taxation and Customs Union Pr sentation Powerpoint Share of company cars company cars represent a very important share of the car stock in the EU: in EU 18 countries out of total cars sales in 2008 close to 50% are company registrations ( million out of million registrations) The relative size of company cars rise with the size of the car segment.
4 In the lowest segment (mini) the share is 31% while in the upper medium segment 70% (shares are shown in the graph of the next slide) The highest shares are in Germany and Sweden (60%), the lowest in Greece (24%) in 2008 out of 19 EU MSs european commission / taxation and Customs Union Pr sentation Powerpoint Structure of registrations by segment in 18 EU countries, 2008, millions of cars registered (volume) Sigurd N ss-Schmidt|, Brussels,1th December 2009 31% 38% 48% 65% 70% 24% 69% 62% 52% 35% 30% 76% 1 Mini 2 Small 3 Lower Medium 4 Medium 5 Upper Medium 6 Large Registrations, millions company registrations Private registrations european commission / taxation and Customs Union Pr sentation Powerpoint Calculation of subsidy levels Subsidy rate = % difference between the tax-neutral tax base and the actual imputed tax base (taxable income)
5 Divided by the average annual cost for the firm Actual imputed tax base is in most countries a fixed share of the value of the car (based either on the list price or acquisition price), these imputation rates vary from 6% to 30%, in some cases the rate may depend on the mileage or the level of private use In 6 countries other ways The neutral tax base would be the one that either corresponds to: A)actual costs incurred by the employer, including for ex. financing cost, depreciation, maintenance, insurance, fuel costs firm cost principle B) The cost the employee would incur if he/she personally owned the car opportunity cost principle The results of the study are mostly based on the firm cost principle Some sensitivity analysis using the opportunity cost principle subsidy levels 0 3% higher (since opportunity costs are larger than firm costs due to the purchasing advantages of the firms)
6 Subsidy levels may also be underestimated, because fringe benefits are taxed at lower rates than gross wage income, which is also subject to to employers social security contributions european commission / taxation and Customs Union Pr sentation Powerpoint Subsidy levels The average weighted subsidy level in 18 EU member States is 23% for low private mileage and 29% for high private mileage In all but one country (Poland) the average subsidy rates exceed 10% The highest subsidy rates are found in Greece (47% for high private mileage) and the lowest in Poland (-4% for high private mileage) The level of subsidy tend to decline with the price of the car; higher car segments tend to have lower subsidy rates (maybe because company -provided fuel constitutes a larger share of the fringe benefit for smaller car segments) There is no apparent cross-country correlation between the company car share and the subsidy level (!)
7 european commission / taxation and Customs Union Pr sentation Powerpoint Sigurd N ss-Schmidt|, Brussels,1th December 2009 Subsidies to private use of company cars measured as percentage gap in imputed tax base (high milage) Segment Small Segment Medium Segment Large Group A: Subsidy up to 10% Finland, Poland Poland United Kingdom Group B: Subsidy 11%-20% Denmark, Sweden Denmark, Finland, France, Netherlands, Sweden, United Kingdom Denmark, Finland, France, Netherlands, Poland, Sweden Group C: Subsidy 21%-30% France, Luxembourg, Netherlands, Spain Austria, Luxembourg, Slovenia, Spain Czech R.
8 , Germany, Italy, Luxembourg, Slovenia, Spain Group D: Subsidy more than 30% Austria, Belgium, Czech R., Germany, Greece, Hungary, Italy, Portugal, Slovakia, Slovenia, United Kingdom Belgium, Czech Republic, Germany, Greece, Hungary, Italy, Portugal, Slovakia Austria, Belgium, Greece, Hungary, Portugal, Slovakia, european commission / taxation and Customs Union Pr sentation Powerpoint Effects of company car subsidies Favourable tax treatment has in principle three kinds of behavioural effect: 1)Increases the total number of cars 2)Increases the use of bigger, more emitting cars 3)Induces more driving because of free fuel (also possibly increase the speed of driving) The size of these effects are estimated by extrapolating the results of the two Dutch studies to the EU level, should be taken as only indicative.
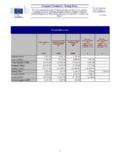
9 1)Total car stock up by 8 21 million cars 2)Average value of cars sold increased by 4000 to 8000 3)Increase of fuel consumption by 4 to 8 % due to the above three effects Upper value is based on the elasticities of Dutch studies taken at face value, the lower value represents more conventional and prudent estimates Upper values may be justified on the ground that subsidy levels may be underestimated for following kinds of reasons: they exclude the effect of social security contributions (since SSCs are paid on gross wages but not on fringe benefits), ignore the effect of low fuels costs on the choice of residence european commission / taxation and Customs Union Pr sentation Powerpoint Fiscal losses Foregone tax revenue is calculated for each country and car segment using information on the subsidy level, marginal tax rates and the share of company cars Estimates are static, no behavioural changes or interaction effects ( on labour market)
10 Are taken into account The total revenue loss is 54 billion or of GDP for EU -18 The highest revenue losses in terms of GDP are found in Belgium (1,2%), Germany (0,9%), Hungary (0,8%) and Austria, Luxembourg, Slovenia (0,6%), the smallest in Poland (0%) european commission / taxation and Customs Union Pr sentation Powerpoint Welfare effects Welfare effects are due to the distorting effect of tax subsidies on consumer choice: because the subsidy lowers the price consumers use more car services than would be socially optimal In this case welfare loss is related to the three behavioural effects discussed above: more cars, more expensive cars, more mileage The size of welfar