Transcription of European Comparisons - Health and Safety Executive
1 Health and Safety Executive European Comparisons Summary of UK Performance Contents Summary 2. Injuries at work in the EU 3. Work-related ill Health in the EU 4. Health and Safety Practice in the EU 4. Appendix 6. This document is available from Page 1 of 8. Summary The information in this document relates to Health and Safety statistics for 2016/17. The data below come from a variety of sources and they relate to the latest available time periods as indicated. This document can be found at: Health and Safety systems differ across Europe in recording, reporting and enforcement. The European statistical office (Eurostat) publishes data in as standardised a form as possible. Data available on Eurostat shows that UK performance is favourable compared to other EU countries, with relatively low rates of work- related fatalities, injuries and ill Health .
2 Standardised rates of fatal injury across the EU-15 and GB/UK show a downward trend over the period 1994-2014. The EU-15 comprises Austria, Belgium, Denmark, Finland, France, Germany, Greece, Ireland, Italy, Luxembourg, the Netherlands, Portugal, Spain, Sweden and the UK (up to 2010 fatal injury data provided for the UK covered Great Britain only) (Eurostat, ESAW, 2014). The UK consistently has one of the lowest rates of fatal injury across the EU. In 2014 the standardised rate was per 100,000 employees*, which compares favourably with other large economies such as France ( per 100,000 employees), Germany ( per 100,000 employees), Italy ( per 100,000. employees) and Spain ( per 100,000 employees) (Eurostat, ESAW, 2014). In 2013, of UK workers reported an injury occurring at work that resulted in sick leave.
3 Compared to other large economies, this was lower than Spain ( ), Italy ( ) and France ( ) and higher than Poland ( ) (Eurostat, EU LFS, 2013). In 2013, of UK workers reported taking time off work due to one or more work-related Health problems. The UK rate is similar to that of Italy ( ) and lower than many other European countries, including Spain ( ), Germany ( ) France ( ) and Poland ( ) (Eurostat, EU LFS, 2013). European surveys reveal that the majority of UK workers are confident that their job does not put their Health or Safety at risk. Additionally, UK businesses are more likely to have a Health and Safety policy, and to follow this up with formal risk assessment, compared to other EU countries. *The overall GB rate of fatal injuries published by HSE for 2014/15 was per 100,000 employees; the standardised rate published by Eurostat accounts for variation in industry composition across EU countries.
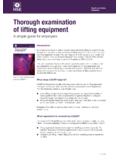
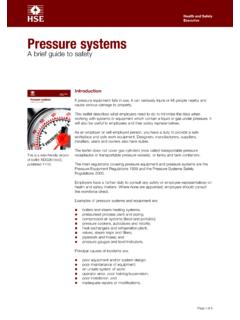
4 Figure 1 Standardised incidence rates (per 100,000 employees) of fatal injuries at work in GB/UK. and the EU, 1994-2014 (Eurostat, ESAW, 2014). Notes: From 2008, the rate of fatal injuries was calculated using updated industry data so the series differs slightly from this point on. Data for UK/GB: for the years 1999-2010 rates are based on GB data only, for 2011 onwards rates are based on UK data (including Northern Ireland). This document is available from Page 2 of 8. Injuries at work in the EU. Fatal injuries at work 1. The 2014 UK standardised rate of per 100,000 employees is considerably lower than that of many EU member states, including other large economies such as France ( per 100,000 employees), Germany ( per 100,000 employees), Italy ( per 100,000 employees) and Spain ( per 100,000.)
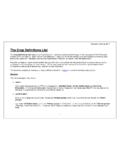
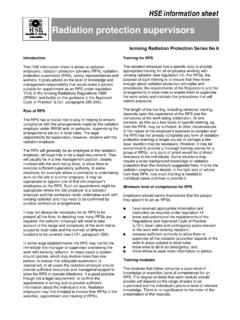
5 Employees). Similarly, the UK three-year average rate for 2011-2013 ( per 100,000 employees) was also the lowest of all EU member states. (For more details see ). 1. Standardised rates are based on fatalities occurring across 12 sectors, including agriculture, manufacturing, and construction (see Appendix for further details on the standardisation process). Work-related road traffic accidents are excluded from these rates, as some member states like the UK. exclude coverage. Hence the transport sector more generally is also excluded by Eurostat. However when reviewing rates for individual countries, it should be kept in mind that removal of road traffic accidents may not always be complete. Figure 2 - Standardised incidence rates (per 100,000 employees) of fatal injury at work, excluding road traffic accidents and accidents on board transport in the course of work for 2014 (Eurostat, ESAW, 2014).
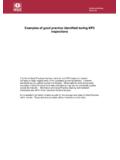
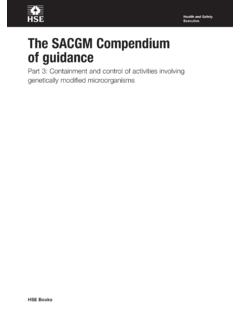
6 Self-reported work-related injuries Figure 3 demonstrates the proportion of workers in the EU that have taken time off work due to a work- 2. related injury . of UK workers report taking time off work due to a work-related injury. Compared to other large economies, the UK rate is lower than Spain ( ), Italy ( ) and France ( ), and higher than Poland ( ). This data is taken from the 2013 Labour Force Survey (LFS), which gives the most comparable data on work-related injuries across the EU. These injuries may not have been officially reported because they are based on workers own definitions of an injury at work. 1. The overall GB rate of fatal injuries published by HSE for 2014/15 was per 100,000 employees; the standardised rate published by Eurostat accounts for variation in industry composition across EU countries.
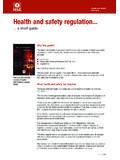
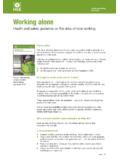
7 See appendix for further details on the standardisation process. 2. Due to methodological problems the EU LFS injury data contains no data for Germany or the Netherlands; as such an EU average figure has also not been produced. This document is available from Page 3 of 8. Figure 3 - Workers who had an injury resulting in sick leave over the last 12 months (%) (LFS, 2013). Work-related ill Health in the EU. Figure 4 displays the rate of workers in the EU that have taken time off work due to work-related ill Health . of UK workers report taking time off work due to one or more work-related Health problem. The UK. rate is similar to that of Italy ( ) and lower than many other European countries, including Spain ( ), Germany ( ), France ( ) and Poland ( ).
8 European ill Health data is taken from the 2013 Labour Force Survey (LFS), which is based on workers'. own ideas of work-related Health problems. Therefore, the survey may not match official definitions in any country. Figure 4 - Workers with one or more work-related Health problem resulting in sick leave (%) (LFS, 2013). Health and Safety Practice in the EU. According to the 2015 European Working Conditions Survey (EWCS), 18% of UK workers believe that their job risks their Health and Safety . This is one of the lowest proportions in the EU, and is favourable in Comparisons to the EU-28 rate of around 23%. Italy (13%) has lower rates than the UK while Germany (18%) has similar rates. However, more workers in France (34%) and Spain (36%) believe that their Health and Safety is at risk because of their job.
9 According to EWCS, differences in levels reported between countries among other things, may reflect This document is available from Page 4 of 8. awareness about topics, objective differences, differences in the economic structure of employment, and differences in legislation and preventive measures. Figure 5 - Do you think your Health or Safety is at risk because of your work? (%) (EWCS, 2015). Managers in the UK businesses interviewed as part of the European Survey of New and Emerging Risks (ESENER) in 2014 were more likely to have documented Health and Safety policy, and more likely to undertake regular Health and Safety checks, than businesses in many other EU countries. Establishments with at least 5 employees, and in all activity sectors, were interviewed for the ESENER.
10 Survey in 2014. Interviews covered specific questions about psychosocial risks such as stress and violence, as well as general Health and Safety management. The chart below demonstrates that around 98% of UK businesses have a document explaining Health and Safety responsibilities and procedures. This is at the top end of all European countries, alongside Italy and Slovenia, and closely followed by Spain (97%). The EU average was found to be 91%, and at the lowest end were Cyprus (64%) and Malta (51%). Figure 6 - Is a document that explains responsibilities and procedures on Health and Safety available to the people working in your establishment? (%) (ESENER, 2014). Around 92% of UK workplaces surveyed undertake regular Health and Safety risk assessments.