Transcription of Evaluating Indoor Air Quality with the Fluke 983 …
1 Evaluating Indoor Air Quality with the Fluke 983 Particle Counter Application Note Introduction Over the past several years, Indoor air Quality (IAQ) has been a much debated and publicized topic, especially as it concerns public health. The EPA estimates that we spend approximately 90% of our time indoors, and further studies indicate that Indoor air in some commercial settings is up to five times more polluted than outdoor air. Airborne particulates come in a variety of forms ranging from animal dander, plant pollen, and airborne bacteria, to fiberglass, asbestos, and combustion parti- cles. Motionless, human beings alone shed up to 500,000 parti- cles ( m) per minute. When active, this level can reach up to 45,000,000 particles per minute.
2 Humidity and temperature play a significant role in the generation rate of these pollutants. To prop- erly identify and troubleshoot IAQ. problems, the technician needs a tool that not only reads particle concentrations, but also provides insight into the environment that causes pollutants to grow. Maintaining acceptable air Quality complaints potentially associated Why Particle Counts levels may not only lower the with air Quality . In either case, Matter costs associated with downtime, the methodology is similar: Different locations have varying but also reduce or remove costs 1. Conduct a survey of credible levels of acceptable particulate associated with expensive fixes staff at the facility. Who has concentrations, driven primarily in the future.
3 The first step in filed complaints, and what are by health and comfort concerns establishing an IAQ maintenance the symptoms? Are those who ( homes, offices, paint booths) program is to determine if a complained centrally located, or contamination ( hospitals, problem currently exists. or dispersed throughout the food and beverage plants, clean- facility? The purpose is to rooms). Excessive levels can IAQ Investigation gauge the level of toxicity as result in medical conditions such evidenced by allergic reactions An IAQ investigation is the first or irritation. as Sick Building Syndrome, lower step in an ongoing maintenance productivity, contaminated prod- program or in responding to uct, or all of the above.
4 From the Fluke Digital Library @ 2. Research the building's history. Particles tend to diffuse very readings provide a high-level When was the building built quickly into the surrounding air, point of reference for the and/or remodeled? Have there making source identification a technician: been any instances of exces- challenging task. One method is sive damage, and how were to take multiple Indoor readings, the repairs carried out? What starting with the complaint area are the maintenance practices first, then moving outwards. As within the facility? For exam- data is collected, take note of any ple, roof or plumbing leaks unusual increases in particulate may have been repaired, but quantity and size. Using the Fluke the underlying water damage 983's integrated temperature and may not have been addressed.
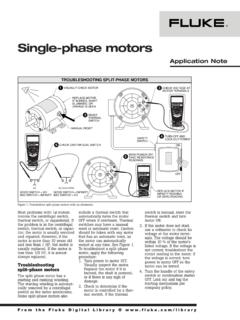
5 Humidity sensors, gauge the 3. Perform a physical inspection. readings against the accepted Technicians need to be aware parameters (see ASHRAE Figure A. of their test environments by Standards 55 and 62) for temper- considering harmful particulate ature and relative humidity. Scenario 1: The particulate levels sources. Within a given loca- displayed in Figure B are from a Compare the particle readings tion, areas containing exhaust new residence (< 5 years), and vents, furnaces, cleaning sup- against the outdoor baseline to get a feel for the relative severity do not indicate any concentra- plies, as well as areas with tions outside of the norm. In a fresh paint and/or carpeting of the particulate concentration, and identify hotspots and path- residential setting, particle levels must be accounted for, espe- are sometimes higher than outside cially if present within a ways that may lead to the particulate source.
6 Continue to readings due to more potential complaint area. Are there any odors or visible sources follow the path of higher concen- particle sources ( pet dander), ( mold)? trations until the source is smaller diffusion area, and often identified. Once the source is less sophisticated filtration. 4. Take air Quality measurements. When conducting a complete remediated, the area is IAQ investigation, temperature, reassessed to ensure the correc- humidity, CO and CO2 read- tive action addressed the problem. ings should also be taken to Multiple tools are often used to identify problems related to carry out such an investigation;. inadequate and/or contami- however, the Fluke 983 includes nated ventilation, potentially both temperature and humidity creating a particulate problem.
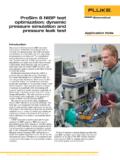
7 Sensors in a device with a six- For example, temperature and channel particle display. Armed humidity readings play a key with this tool, the technician can role in identifying mold and conduct a basic IAQ investigation Figure B. bacteria. A location with high and take appropriate steps to relative humidity and higher treat the problem. Scenario 2: The particulate levels concentrations of particles displayed in Figure C are repre- m or larger may indicate Interpreting the Data sentative of an average office the presence of mold spores, workspace, and do not indicate which should be remediated A correct interpretation of the any concentrations outside of the once identified. data requires an understanding of norm.
8 In a commercial setting, The most efficient procedure the test area. Is the area residen- particle levels should be signifi- for assessing Indoor air Quality is tial or commercial? Is the location cantly less than outside readings to obtain several outdoor air exposed to tobacco smoke or ani- due to better filtration and better readings as baselines, noting mals? Is there construction at or dilution with outside air. where the readings are taken in near the location? A proper relation to the facility. At least one assessment of the environment of the readings should be from can help narrow down the list of near the building's fresh air intake problem particulates. vent. Note, however, the location Concentration limits vary of the intake vent to ensure base- widely according to the size and line readings are not skewed by type of facility, among other pollutant sources, for example, variables.
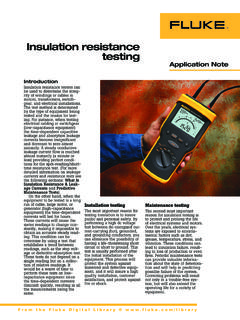
9 However, a high-level locations near a loading dock. An assessment can provide direction Indoor air particulate target is on whether or not a problem then calculated by modifying the exists. The following outside air Figure C. baseline readings by the effi- ciency of Indoor filtering. 2 Fluke Corporation Evaluating Indoor air Quality Scenario 3: The particulate A Cleanroom Exercise levels in Figure D are from an Cleanrooms are an excellent application for a particle counter. For older residential location with illustration purposes, let's put the Fluke 983 to the test in Evaluating visible mold. The readings are an ISO Class 5 (per ISO 14644-1:1999) cleanroom. To qualify as a significantly higher, and steps Class 5 cleanroom, levels cannot exceed the limits for the class in should be taken to remediate each particle size stated in the following table: the mold and address the root cause of the problem.
10 Class Particulate Limits ISO Classification m m m m m m m3 m3 m3 m3 m3 m3. 1 10 2. 2 100 24 10 4. 3 1000 237 102 35 8. 4 10000 2370 1020 352 83. 5 100000 23700 10200 3520 832 29. 6 1000000 237000 102000 35200 8320 293. 7 352000 83200 2930. 8 3520000 832000 29300. Figure D. 9 35200000 8320000 293000. Our test is concerned with the concentration of m particulates in the room. Several 2-liter samples are taken from six different locations inside the cleanroom, with the following results: Ave. Concentration Concentrations (C1) (AC1). Location (L) 1 2 3 4 5 6. Scenario 4: If the particle source A 750 560 655 730 674. in Scenario 3 is not visible, use B 1575 1250 750 950 1100 1300 1154. particle size tables such as C 1300 850 980 1125 1350 975 1097.