Transcription of EVALUATION OF PRODUCTION PRODUCTIVITY …
1 ISSN: 2277-9655 [Badi* et al., 5(10): October, 2016] Impact Factor: IC Value: CODEN: IJESS7 http: // International Journal of Engineering Sciences & Research Technology [740] IJESRT INTERNATIONAL JOURNAL OF ENGINEERING SCIENCES & RESEARCH TECHNOLOGY EVALUATION OF PRODUCTION PRODUCTIVITY USING OVERALL EQUIPMENT EFFECTIVENESS Ibrahim Badi*, Ali Shetwan, Zakaria Maafa, Abd-Alrhman Al-Shaafi * Mechanical Engineering Department, Faculty of Engineering, Misurata University, Libya Industrial Engineering Department, College of Industrial Technology, Misurata, Libya Industrial Engineering Department, Faculty of Engineering, Misurata University, Libya DOI: ABSTRACT The purpose of this paper is to evaluate PRODUCTION PRODUCTIVITY by the use of the Overall Equipment Effectiveness (OEE) indicator.
2 The OEE measures how effectively an equipment is utilized. A case study at Libyan Iron and Steel Company was conducted. The results show that the OEE for PRODUCTION line 2 is much better than PRODUCTION line1. However, the average OEE for both PRODUCTION lines are and respectively. These low values of OEE are a result mainly of the reduction in the quality rate. The average quality rate for both PRODUCTION lines 1 and 2 are and respectively. KEYWORDS: Performance, quality, overall effectiveness, Libyan steel. INTRODUCTION OEE has been used extensively for measuring equipment PRODUCTIVITY improvement. OEE was recognized as a fundamental method for measuring equipment performance from the late 1980s and early 1990s.
3 Now it is accepted by management consultants as a primary performance metric. When it is applied by autonomous small groups on the shop-floor together with quality control tools, OEE is an important complement to the traditional top-down oriented performance measurement systems. OEE is often used as a driver for improving performance of the business by focusing on quality, PRODUCTIVITY and equipment availability issues and hence aimed to reduce non-value activities that are often inherited in manufacturing processes. The OEE was born as the backbone of Total Productive Maintenance (TPM) and then of other techniques employed in asset management programs, Lean manufacturing [1]. OEE measures how effective the machine is used for manufacturing in practically as opposed to in theory [2].
4 Availability, performance rate, and quality rate are the three important parameters which form the product of OEE [3]. The six big losses such as breakdowns, setup and adjustments, small stops, reduced speed, start-up rejects and the PRODUCTION rejects are the main contribution that affect the performance of the machines [4]. The OEE can be expressed as the ration of the actual output of the equipment divided by the maximum output of the equipment under the best performance condition. The aims of TPM is to achieve the ideal performance and achieve zero losses, which means no PRODUCTION scrap or defect, no breakdown, no accidents, no waste in the process running or changeover. However, the quantification of these accumulations of waste in time and its comparison to the total available time can give the PRODUCTION and the maintenance management a general view of the actual performance of the plant.
5 Consequently, it can help to focus on the improvement of the biggest loss. Table (1) shows the six big loss category [5]. OEE approach has been widely used as quantitative tool for measuring equipment performance in industries [6]. ISSN: 2277-9655 [Badi* et al., 5(10): October, 2016] Impact Factor: IC Value: CODEN: IJESS7 http: // International Journal of Engineering Sciences & Research Technology [741] Table 1. Six big loss category Computation of OEE Six Big Loss Category OEE Loss Classification Availability rate= operating time/ loading time Equipment failure Availability rate Setup and adjustments Performance rate= Net operating time/ operating time Idling and minor stoppage Performance rate Reduced speed Quality rate= (processed amount- defect amount)/ processed amount Defects in process Quality rate Reduced yield In practice, however, OEE is calculated as the product of availability, performance and quality.
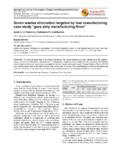
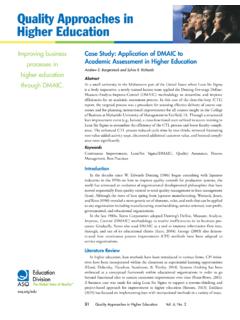
6 OEE = Availability Performance Rate Quality Rate (1) Figure (1) shows an overview of OEE. Figure1. OEE overview CASE STUDY The Libyan Iron and Steel Company (LISCO) is considered one of the largest industrial companies in Libya, located on an area of 1,200 hectares near the town of Misrata, just 210 kilometers to the east of the city of Tripoli. The design capacity of the company is about million tons of liquid steel per annum adopting direct reduction of iron pellets using domestic natural gas. On 09/09/1989, it was the opening of the PRODUCTION units and so the company has entered the stage of PRODUCTION .
7 The study is conducted at the bars and road mill plant. The plant consists of two lines to produce bars with designed capacity of 400,000 tons of bars. The first line was commissioned in 1988 while the second line in 1989, also in 1997 double strand line was implemented, with an annual designed capacity of 400,000 tons, it has started operating in 1998. Data analysis The study considers the period of the first five months in 2016. The collected data is then classified and arranged in a way that can easily calculate the overall efficiency of the equipment in bars and road mill plant as shown in Table (2). This data is collected from the PRODUCTION and control department, maintenance department, Computerized Maintenance Management System (CMMS) and the reports issued from planning and maintenance department of LISCO related to bars and road mill plant.
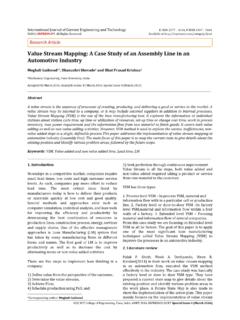
8 Overall equipment efficiency The OEE is described as one such performance measurement tool that measures different types of PRODUCTION losses and indicates areas of process improvement. The OEE is a result that can be expressed as the ration of the actual output of the equipment divided by the maximum output of the equipment under the best performance condition [6]. Total Available PRODUCTION Time Planned PRODUCTION Time Net PRODUCTION Time Gross Operating Time Availability Losses Net Operating Time Speed Losses Valuable Operating Time Quality Losses Equipment Failure Set-up and adjustments Idling and minor stoppages Reduced Speed Defects in Process Start-up Losses Planning Factor (PF) Availability Factor (A) Performance Factor (P) Quality Factor (Q) ISSN: 2277-9655 [Badi* et al.]
9 , 5(10): October, 2016] Impact Factor: IC Value: CODEN: IJESS7 http: // International Journal of Engineering Sciences & Research Technology [742] Table 2. The collected data for PRODUCTION lines 1 and 2 PRODUCTION line 1 PRODUCTION line 2 Months Months Jan. Feb. Mar. Apr. May Jan. Feb. Mar. Apr. May PRODUCTION (ton) Defects (ton) PRODUCTIVITY (%) Planned Capacity (ton) 38 38 38 38 38 40 40 40 40 40 Total working hours 744 696 744 720 744 744 696 744 720 744 Operating planned (ton) 616 578 616 592 616 589 578 594 570 594 OEE calculation As can be shown in equation (1), the OEE can be calculated by multiplying the three main factors: [1] Availability, [2] Performance and, [3] Quality.
10 RateQualityrateePerformanctyAvailabiliOE E (1) Availability Availability is used to measure the total lost time when PRODUCTION line is not operating because of breakdowns, set-up adjustment and other stoppages. The availability for both PRODUCTION lines is calculated as given in equation (2). =( ) 100 (2) Total working hours for each PRODUCTION line can then be calculated as given in equation (3). = (3) The results of availability for both PRODUCTION lines are presented in Table 3. Table 3. Availability index for PRODUCTION lines 1and 2 PRODUCTION Line 1 PRODUCTION Line 2 Months Average Months Average Jan.