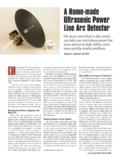
Transcription of Every ham needs an RF power meter. Here’s a high ...
1 From January 2011 QST ARRLI first got the idea of designing and build-ing a power meter from a construction article in The 1997 ARRL Handbook entitled The Tandem Match An Accurate Directional Wattmeter by John Grebenkemper, KI6WX. John described the difficulties of building an accurate power meter using diodes to convert RF to dc because of the diode s inherent nonlinearity. He describes a fairly complicated (at least it looked complicated to me) analog circuit that corrects for this nonlinear behavior and that also calculates and displays SWR. Shortly after reading this article, I noticed several articles in QST that described a new integrated circuit, the Analog Devices AD8307, that converts a low level RF signal into a voltage proportional to the logarithm of the signal s power . I became intrigued with this device because it eliminated the difficulties associated with the use of diodes and would work over a wide range of pow-ers, from milliwatts to the legal limit.
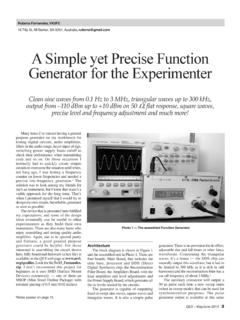
2 In addition, I was interested in learning more about microprocessors. Thus, I devel-oped the idea of using AD8307s in the front end of a power meter to convert from RF watts to dBm, then a microprocessor with a built-in analog-to-digital converter (ADC) to process the dBm signals and display power and SWR on a liquid crystal display panel and, perhaps, a panel meter. The primary use I had in mind for this unit was to monitor the output power and tuning of my rig. I live in an area with antenna restrictions so must operate with a wire antenna whose configuration is more determined by my lot size and configuration than by electrical considerations. Thus, my antenna does not present a good match to 50 W on any amateur band. As a conse-quence, I always use a manual antenna tuner. My setup, including the power meter described here, is shown in Figure 1. RF power generated by my transmitter is routed via RG-8 coaxial cable through a directional coupler to my antenna tuner, which is connected to my antenna with about 60 additional feet of RG-8.
3 The directional coupler contains circuits that sample the A Modern Directional power /SWR MeterEvery ham needs an RF power meter. Here s a high performance unit to build at Kaune, W7 IEQ67(3 N67(3 &+9)2$$1786%92;%. ,1021,021,3 $03$*&63/,71%1%15$1)$1) )) 6&37:,1 3%77;5 ;/2&. ) ) ) ) ) 32:(50,&3+21(6 *(1(3(3 :$9 * :6:5 TransceiverDirectional Coupler073 ANTENNATRANSMITTERINDUCTANCEANTENNASELEC TIONMETERPOWERT unerForward PowerReflected PowerQS1101 Kaune01 power MeterFigure 1 W7 IEQ station setup, including the power meter being described here. RF power flowing from the transmitter to the tuner (the forward power ) and the RF power reflected back from the tuner to the transmitter (the reflected power ). These samples are sent via RG-58 cable to the two input channels of the power meter. This article describes the directional coupler and the power meter in enough detail so that an interested ham can duplicate the device or, perhaps, improve on my design.
4 Directional CouplerThe directional coupler I built is based on the unit described in the article by John Grebenkemper mentioned earlier. Coaxial (SO-239) UHF sockets were mounted on opposite faces of an aluminum box (Radio Shack 270-238). A cable from the transceiver was connected to one of these sockets and the other was connected to my antenna tuner. Two BNC sockets were mounted 2 inches away from these coax sockets. Two short lengths of RG-8 coaxial cable were prepared by exposing about 1 4 inch of the shield on one end of each. I wound 31 turns of #26 AWG magnet wire on each of two Amidon FT-82-67 ferrite toroids so that the windings occupied about 75% of the circumferences of the cores. These toroids were then slipped over the two sections of RG-8 until they were about 1 2 inch from the end of the exposed shield. One section of RG-8 was soldered between the two UHF sockets and the other between the two BNC sockets.
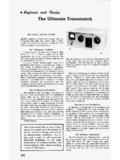
5 Holes were drilled in the PC board shields to accommo-date these two lengths of cable. The exposed braid at one end of each sec-tion of RG-8 was soldered to a nearby solder lug, as shown in Figure 2. (Do not solder the other end of the braid to ground.) This braid forms a shield that prevents capacitive cou-pling between the transmission line and the wire wound on the toroids. In addition, one lead from each of the toroids was soldered to these lugs. The other lead from each toroid was passed through the center shield and soldered to the center terminal of the nearby connector. Small rubber grommets were used to insulate the points that these leads passed through the center shields. The forward and reflected power samples coupled from the main line are reduced by a factor of 1/N2, where N = 31 is the number of turns of wire on each toroid. Thus the forward and reflected power samples are reduced by about 30 dB.
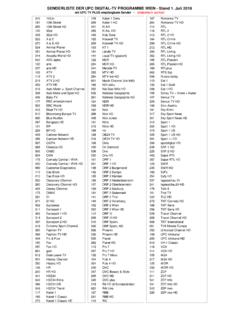
6 For example, if a transceiver were delivering a power of 100 W to a pure 50 W load, the forward power sample from From January 2011 QST ARRLF igure 3 Front panel of power meter. The LCD shows the peak envelope power (PEP), the average envelope power (AEP) and the SWR. The two knobs control the contrast and back lighting of the LCD. One toggle switch determines whether forward or load powers are displayed. A second switch sets the averaging time for the AEP calculation. The meter shows the SWR and is used for tuning purposes. Figure 2 Compled directional coupler. the directional coupler would be about W (20 dBm) and the reflected power sample, in theory at least, would be exactly 0 because there would be no reflections from the 50 W load. Of course, in a real device, the reflected power sample will never be exactly 0. The directivity of a directional coupler is defined as the ratio of the forward power sample divided by the reflected power sample when the coupler is terminated in 50 W.
7 In my cou-pler, the directivity, measured using an inex-pensive network analyzer, is at least 35 dB at MHz and 28 dB at 30 MHz. power /SWR Meter Circuit DescriptionFigure 3 shows a front panel view of the power meter. I used a two line, 20 charac-ters per line, liquid crystal display (LCD) to display the measured peak (PEP) and average (AEP) envelope powers as well as the standing wave ratio (SWR). Depending on the position of a front panel switch, the power meter calculates either the peak and average envelope power traveling from the transceiver to load (the forward power ) or the peak and average envelope powers actu-ally delivered to the load (the forward power minus reflected power ). The average enve-lope power (AEP) represents an average of the forward or load powers over an averaging period, depending on the position of a second front-panel switch, of either or sec-onds. I generally use the shorter period, but sometimes use the longer when I am operat-ing SSB.
8 I included a 1 mA-movement analog meter on the front panel to facilitate antenna tuning. This meter continuously displays the quantity 1 1/SWR, where SWR is the standing wave ratio on the line. Thus, an SWR of corresponds to a meter reading of 0, that is no deflection of the meter. An SWR of 2 results in a 50% deflection of the meter, while an SWR of 5 produces an 80% deflection of the meter. I have found this method of displaying SWR to be effective for antenna tuning. Figure 4 shows the schematic diagram and parts list of the power meter. The for-ward and reflected power samples from the directional coupler enter at the left through two identical channels. Since the logarith-mic detectors, U1 and U2 in Figure 4, can only handle a maximum input power of about 15 dBm, I placed two external 20 dB attenuators (Mini-Circuits HAT-20) in cables from the directional coupler. As noted earlier, the directional coupler has an internal attenuation of about 30 dB, so the total attenuation in each channel is about 50 dB.
9 Thus, a rig operating at a power level of 1 kW (60 dBm) will result in an input to the forward power channel of about 10 dBm. The internal input impedances of the logarithmic detector chips, U1 and U2, are about 1100 W in parallel with pF. These impedances are in parallel with R1 and R2, respectively, both W, yielding net input impedances of W. Capacitors C7 and C8 set the time constants of the output networks of U1 and U2 to filter out RF components in the signal while retaining the modulation components with frequencies up to about 20 kHz. In other words, the outputs of U1 and U2 follow the modulation enve-lope of the RF signal. The output signals from U1 and U2 enter U3 and U4, sample-and-hold (S/H) inte-grated circuits. These circuits operate as fol-lows: As long as the voltages on pins 8 are held high (+ V), the outputs on pins 5 are the same as the inputs (pins 3). However, if the voltages on pins 8 are set low ( 0 V), the outputs become frozen at the values at the inputs at the moment when the voltages on pins 8 were changed.
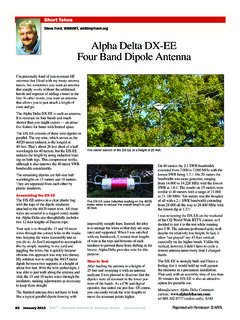
10 In this way, input volt-ages from the forward and reflected power logarithmic detectors can be sampled at the exact same time and held for subsequent serial reading into the microprocessor. I used a PIC microprocessor in the power meter for several reasons. PIC processors seem to be used in a many types of amateur equipment, so it seemed sensible to become familiar with them. They are remarkably inex-pensive. Being RISC (reduced instruction set computers), they have a relatively small num-ber of instructions to learn. Also, you can purchase units that contain a variety of on-chip peripherals, such as analog-to-digital converters (ADC). And, finally, there are soft-ware and a large number of helpful documents available for no charge from the producer of these devices ( ). Because I needed a device with at least two channels of ADC and a way of outputting a voltage that would drive an analog panel meter, I selected the PIC16F876A, which includes five input analog channels and a pulsewidth modulated output.