Transcription of Excel 2 (Advanced) - glenn.osu.edu
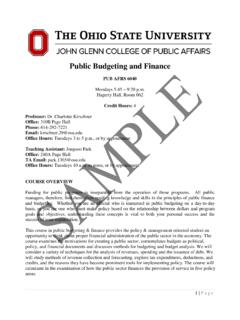
1 1 Excel 2 ( advanced ) PUB AFRS 6514 Autumn 2018 Wednesdays 5:45 7:35 pm Page Hall 040 Credit hours: 1 Professor: Kim Young, PhD e-mail: Office Hours: Wednesdays 2:30-4:30 pm, and by appointment; Page Hall 310B Course Materials Optional Textbook Walkenbach, John (2015). Excel 2016 Bible. Wiley. ISBN: 978-1-119-06751-1. This book is available electronically from OSU Library. All other course materials will be provided through Carmen. Students can access textbook information via the Barnes & Noble bookstore website: as well as from their BuckeyeLink Student Center. This information is disseminated by B&N to all area bookstores. You may buy from a store of your choice and/or shop for books (always use ISBN# for searches) on line. Course Description Overview Businesses, governments, schools, alumni clubs, political organizations, charities, healthcare institutions, and virtually every other type of organization, are collecting/creating vast amounts of data.
2 Many different tools are available for managing, tracking, and analyzing these data to provide meaningful results. Microsoft Excel has become a primary toll for keeping simple lists, tracking information, managing complex analyses of data, and creating efficient and effective reports. Excel is an extremely powerful program. It is important to understand the benefits as well as the challenges of Excel and to learn how to use this tool effectively. For instance, Excel can save valuable time and produce novel insights but it is possible to accidentally introduce errors into formulas and unintentionally corrupt data. PA 6513 is the first of two Excel skills courses. PA 6513 focuses on how to use Microsoft Excel for basic data entry, formatting, filtering and sorting, basic functions, formulas, nested formulas, and basic charts and graphs.
3 PA 6514 is the second course in the Excel skills series. This course focuses on how to use intermediate to advanced Microsoft Excel functionality to create nested formulas and conduct data analysis through the use of pivot tables and interactive worksheets. The class will be a mix of lecture/discussion and hands on work with Excel . The hands on work will be lab-style activities involving independent completion. Real world examples are used to provide context. 2 Who Should Take the Class? Students should take this course if they have taken the Basic Excel class (PA 6513) during the 1st session and/or have an understanding of how to use formulas, create basic graphics, and navigate the Excel menus. If you have questions, please contact the instructor.
4 Student Learning Objectives Upon successful completion of this course, students will have: Gained an understanding of the advanced functionality of Microsoft Excel Utilized Excel to manage and analyze data Applied advanced skills to manipulate and create complex spreadsheets in Excel Utilized Excel to support decision making and communicate with decision makers Course Requirements The following components make up the final course grade: advanced Formula Exercise: 15% OR 0% Formula Management Exercise: 15% OR 30% Table/Pivot Exercise: 20% Final Project Progress: 10% Final Excel Project: 40% The advanced Formula Exercise is an optional exercise. If submitted, it is worth 15% of the final course grade and the Formula Management Exercise is then worth 15% of the final grade.
5 If the advanced Formula Exercise is not submitted, the Formula Management Exercise will be worth 30% of the course grade. Any advanced Formula Exercise submission will be graded and will count toward the course grade. If you do not want this exercise to count toward your course grade, do not submit it to Carmen. Transformation of numerical grade to a letter grade will be according to the schedule below: A 93-100 B- 80-82 D+ 68-69 A- 90-92 C+ 78-79 D 60-67 B+ 88-89 C 73-77 E <60 B 83-87 C- 70-72 A Note about Class Contribution Class engagement is critical to making this course as valuable (and as interesting!) as possible for you and your fellow students. Sharing about your prep before class and gaining familiarity with the lab data and content enables in-class contributions.
6 Participating during in-class conversations regarding those readings, asking questions, clarifying assignments, participating in the lab portion of the class, and sharing personal and professional experiences that can aid the class during discussions are all valuable contributions. Course Exercises / Projects Exercise 1: advanced Formula Exercise For this exercise, you will use a dataset uploaded to Carmen to analyze data and create new fields using various advanced formulas. Formula creation will be based on prompts in the dataset and must include formulas with two or more functions comprising the formula. Grading is based on formula accuracy. Partial credit will be given if portions of the formula are correct. Completed worksheets should contain the dataset, formulas you created, and explanations (if necessary).
7 Exercise 1 will be due to the Carmen Dropbox by 11:59PM on Thursday, November 1st. Final Project Progress Report For the final project, you will select a topic and find a dataset to work on throughout the term. For the project progress report, please identify the topic you have selected and provide at least one dataset for that topic. You must have the data in hand. Identifying the source of the data or requesting but waiting on the data will not count as sufficient progress. Include a brief outline of what you plan to do with the data for your final project. For example, you could provide a dataset of airline departures from Port Columbus and outline what type of information you want to report, such as on-time departures during heavy snowfall in leap years.
8 This progress report will be due to the Carmen Dropbox by 11:59pm on Thursday, November 8th. 3 Exercise 2: Formula Management Exercise Building on the skills you already have, combined with those skills we have developed thus far in the class, you will use a dataset uploaded to Carmen to show some formula management techniques. These will include: Create defined Names and use those names in a formula. Fix formulas that have errors and include a brief description of how you fixed those errors (how did you find the error, what tools did you use in Excel , etc.) Exercise 2 will be due to the Carmen Dropbox by 5:30PM on Thursday, November 15th. Exercise 3: Table / Pivot Exercise Utilizing techniques learned in class and a dataset provided, create tables and pivots and utilize them with formulas.
9 Create tables Create formulas to answer questions provided. Formulas must use reference tables by table name and field names Create pivot tables & use them to answer questions provided. Explain what the pivot tables are showing Exercise 2 will be due to the Carmen Dropbox by 11:59PM on Thursday, November 29th. Final Project Using dataset(s) of your choosing, create a one page report that includes the following sections: Overview and inclusion of the original dataset (data source, questions posed) Data Preparation (what you did with the data to make it usable for your analysis). Data Analysis: for each item below, briefly explain what the component is showing. Be sure to include why that information is important - link it to the question(s) posed. o 3 unique columns added to the dataset (using formulas) o 2 standalone formulas (made up of at least 2 functions) o 2 unique pivot tables o 2 unique graphs Key Findings: summarize key findings.
10 These should relate to the questions posed, answering them directly. Conclusion: provide a short paragraph summarizing the entire report. Notes: You should be creative, but remember that the objective is to create something a senior manager would recognize as professional and valuable. These people are busy! Be direct, clear, and succinct. The final project is worth 40 points. Points will be distributed as follows: Overview and Data Preparation: 8 points Data Analysis: 10 points Key Findings: 10 points Conclusion: 5 points Visual appeal, text flow and grammar: 7 points The Final Project is due to the Carmen Dropbox by 11:59pm on Tuesday, December 11th. Course Policies Assignment Submission All assignments should be submitted through Carmen by the day/time they are due.