Transcription of Executive Summary - RMIIA
1 Date: May 2, 2016 Regarding: 2013-2015 United States Hail Loss Claims (Public Dissemination) Prepared By: David Fennig, Strategic Analyst Executive Summary This ForeCASTSM illustrates the trends in hail loss claims in the United States (US) submitted from 2013 through 2015. Overall, hail loss claims decreased 21 percent from 2013 through 2015. Texas was the top state in hail loss claims from 2013 through 2015 with 394,572 hail loss claims. The top 10 states represented 66 percent of the total number of hail loss claims during this timeframe.
2 Personal Property Homeowners (PPHO) was the policy type most affected by hail loss claims from 2013 through 2015. On average, PPHO policies were represented over 50 percent more often than the next most popular policy type (Personal Automobile) in hail loss claims over that three year span. A national hail loss map provides a visual depiction of the volume and distribution of hail loss claims. Introduction According to the National Oceanic and Atmospheric Administration ( noaa ) ( ), multiple severe hail storms between 2013 through 2015 have caused billions of dollars worth of damage across the US.
3 In April, 2015 alone, powerful storms with hail caused widespread damage across Texas, Missouri, and Illinois. Additional storms caused hail damage across the Central, Southeast and Northeast Each of these storms are estimated by the noaa to have caused over $1 billion in damage. In an effort to identify recent trends in hail loss claims, an analysis of the Insurance Service Office (ISO) ClaimSearch data was performed. Claims containing the loss type hail with a loss date between 2013 and 2015 were analyzed. This report is divided into 2 sections.
4 Section 1 analyzes the overall US hail loss claims from 2013 through 2015. Section 2 contains geographic analysis of hail loss claims by loss state. Finally, an appendix provides totals for all states and policy types included in this report. Section 1: United States Hail Loss Claims A total of 2,116,980 hail loss claims were identified with a loss date from January 1, 2013 through December 31, 2015. Hail loss claims increased 14% between 2013 and 2014; from 720,473 to 824,325. Hail loss claims then decreased 31% between 2014 and 2015; from 824,325 to 572,182 respectively.
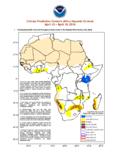
5 Overall, from 2013 through 2015, hail loss claims decreased 21% from 720,473 to 572,182. Hail Loss Claims By Loss Month The following table shows hail loss claims, by loss month, from 2013 through 2015. The majority of hail loss claims occur in the spring and early summer months, between March and July. This is likely due to increased numbers of thunderstorms during this time period. Research performed at the noaa Storm Prediction Center 2013-2015 United States Hail Loss Claims May 2, 2016 Page 2 ( noaa Severe Weather Event Summaries) supports these findings.
6 Between 2013 and 2015 noaa hail reports were found to be most numerous in April, May, June and July, which is reflected in the monthly averages of hail loss claims shown below. Hail Loss Claims 2013 - 2015: By Month Month 2013 2014 2015 Monthly Average January 5,826 4,235 2,720 4,260 February 33,737 8,780 2,890 15,136 March 121,916 33,966 27,334 61,072 April 140,984 141,661 164,476 149,040 May 149,528 250,561 95,171 165,087 June 76,799 190,225 120,232 129,085 July 53,983 68,045 44,922 55,650 August 90,129 27,191 48,615 55,312 September 23,658 54,892 24,970 34,507 October 12,569 36,479 28,160 25,736 November 8,622 3,991 8,437 7,017 December 2,722 4,299 4,255 3,759 Total 720,473 824,325 572,182 Yearly Percent Change - 14% -31% Note.
7 Percentages have been rounded to the nearest whole number. The following graph shows hail loss claims by month from 2013 through 2015. 050,000100,000150,000200,000250,000300,0 00123456789101112 Hail Loss Claims 2013 -2015: By Month201320142015 Average2013-2015 United States Hail Loss Claims May 2, 2016 Page 3 Hail Loss Claims By Loss State The following table represents the top 10 loss states with the largest combined total of hail loss claims from 2013 through 2015. These loss states represent 66 percent of the total hail loss claims during this time.
8 Texas was the top loss state with 394,572 claims, or 19% of the total claims between 2013 and 2015. This was more than double the state with the second highest amount of hail claims, Colorado. The hail loss claim totals for all states are viewable in Appendix 1. Hail Loss Claims 2013 - 2015: Top 10 Hail Loss States State 2013 2014 2015 Total State % of US Hail Claim Total Texas 122,005 134,028 138,539 394,572 19% Colorado 32,741 99,565 50,285 182,591 9% Nebraska 45,860 80,293 22,193 148,346 7% Kansas 52,404 39,222 36,337 127,963 6% Illinois 24,002 63,723 32,788 120,513 6% Oklahoma 60,131 11,760 26,302 98,193 5% Missouri 14,703 45,264 34,953 94,920 4% Minnesota 45,860 16,688 30,641 93,189 4% South Dakota 27,819 30,634 16,428 74,881 4% Indiana 30,733 21,996 12,552 65,281 3% Yearly Top 10 State Totals 456,258 543,173 401.
9 018 1,400,449 Top 10: % of Yearly Total 63% 66% 70% 66% Note: Percentages have been rounded to the nearest whole number. The following graph shows hail loss claims for the top 10 hail loss states from 2013 through 2015. 050,000100,000150,000200,000250,000300,0 00350,000400,000 TXCONEKSILOKMOMNSDINHail Loss Claims 2013 -2015: Top 10 Loss States201320142015 Total2013-2015 United States Hail Loss Claims May 2, 2016 Page 4 Hail Loss Claims By Policy Type The following table represents the top 5 policy types identified in hail loss claims from January 1, 2013 through December 31, 2015.
10 The top 5 policy types below represented 96% of the total hail loss claims during this time. The policy type Personal Property Homeowners was the top policy type with 1,118,469, or 53 percent of the total number of hail loss claims between 2013 and 2015. The policy type claim totals for all states are viewable in Appendix 1. Hail Loss Claims 2013 - 2015: Top 5 Hail Loss Policy Types Policy Type 2013 2014 2015 Total % of US Policy Type Total Personal Property - Homeowners 376,076 418,410 323,983 1,118,469 53% Personal Auto 270,519 288,342 164,882 723,743 34% Personal Property - Farm 14,122 59,892 34,463 108,477 5% Commercial Multi-Peril 17,996 18,403 12,772 49,171 2% Personal Property - Fire 8,340 10,449 10,808 29,597 1% Yearly Top 5 Policy Totals 687,053 795,496 546,908 2,029,457 Top 5: % of Yearly Total 95% 97% 96% 96% Note.