Transcription of EXECUTIVE SUMMARY - TNTP
1 SUMMARYT hree years ago, we set out to answer that question. We suspected that we could gain a better understanding of students daily experiences by observing those experiences in action, looking closely at the work students were doing, and most importantly, by asking students directly. We hypothesized that a clearer picture of students daily experiences could point the way toward changes to policy and practice that would bridge the gap between what students need and what they re getting every day in their classrooms.
2 We partnered with five diverse school systems, rural and urban, district and charter, to listen to students views on their educational experiences and observe how those experiences played out, in real time, in their classrooms. While student experiences include many things within and outside school, we chose to focus on a set of in-school elements that offered a window into what students were doing in their classes and how they perceived that all, we wanted to understand students aspirations for themselves, what kind of lives they wanted to lead, and how school was preparing them to live those lives or letting them down.
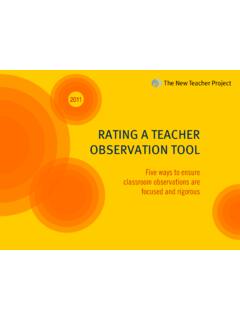
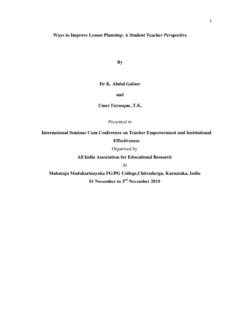
3 THE opportunity MYTHWe observed nearly lessons1,000We partnered with diverse school systemsFIVEWe reviewed nearly assignments5,000We analyzed more than student work samples20,000We collected nearly real-time student surveys30,000 How can so many students be graduating from high school unprepared to meet their goals for college and careers? 2 EXECUTIVE SUMMARYWhen students who started the year behind grade level had access to stronger instruction, they closed gaps with their peers by six SUMMARYWe observed nearly lessonsWe analyzed more than student work samplesHERE S WHAT WE FOUND:Students have big, clear plans.
4 They want to be doctors and lawyers, teachers, artists, and athletes. Ninety-four percent of students we surveyed aspire to attend college , and 70 percent of high schoolers have career goals that require at least a college degree. Most students do what they re asked in school but are still not ready to succeed after school. In the nearly 1,000 lessons we observed, students were working on activities related to class 88 percent of the time. They met the demands of their assignments 71 percent of the time, and more than half brought home As and Bs.
5 Yet students only demonstrated mastery of grade-level standards on their assignments a benchmark for being on track for the lives most of them want as adults 17 percent of the time. That gap exists because so few of their assignments actually gave them the chance to demonstrate grade-level spend most of their time in school without access to four key resources: grade-appropriate assignments, strong instruction, deep engagement, and teachers who hold high expectations. Students spent more than 500 hours per school year on assignments that weren t appropriate for their grade and with instruction that didn t ask enough of them the equivalent of six months of wasted class time in each core subject.
6 And students reported that their school experiences were engaging just 55 percent of the time overall (among high schoolers, only 42 percent of the time). Underlying these weak experiences were low expectations: We found that while more than 80 percent of teachers supported standards for college readiness in theory, less than half had the expectation that their students could reach that of color, those from low-income families, English language learners, and students with mild to moderate disabilities have even less access to these resources than their peers.
7 For example, classrooms that served predominantly students from higher-income backgrounds spent twice as much time on grade-appropriate assignments and five times as much time with strong instruction, compared to classrooms with predominantly students from low-income access to the four resources can and does improve student achievement particularly for students who start the school year students did have the chance to work on content that was appropriate for their grade, they rose to the occasion more often than not.
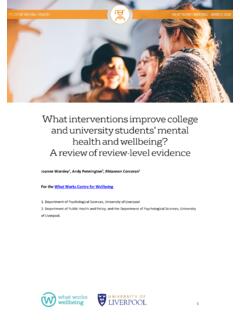
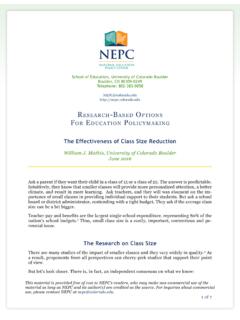
8 Those chances paid off: In classrooms where students had greater access to grade-appropriate assignments, they gained nearly two months of additional learning compared to their peers. Classrooms with higher levels of engagement gained about two-and-a-half months of learning. In classrooms where teachers held higher expectations, students gained more than four months. The relationships between the resources and student outcomes were even stronger in classrooms where students started the year off behind. When students who started the year behind grade level had access to stronger instruction, for example, they closed gaps with their peers by six months; in classrooms with more grade-appropriate assignments, those gaps closed by more than seven 1 | STUDENT SUCCESS ON GRADE-LEVEL WORK VERSUS OPPORTUNITIES TO DO GRADE-LEVEL WORKS uccess rates on grade-level work were 4 out of 10 classrooms with a majority of students of color never received a single grade-level assignment.
9 All students tended to succeed on grade-level work, but many students of color were denied any opportunity to even try of classrooms that had no grade-level assignments in classrooms with mostly white students38%12 %Percent of classrooms that had no grade-level assignments in classrooms with mostly students of colorPercent of classrooms that had no grade-level assignments in classrooms with mostly white studentsNOTE: Grade-level assignments are assignments that earned our highest rating on the content domain.
10 See the Technical Appendix at for more details on how we rated assignments. To calculate the success rate in both types of classrooms, we combined all grade-level assignments from eligible classrooms. Because some classrooms provided more grade-level assignments than others, and because some classrooms never provided grade-level assignments, some classrooms (and students) are represented more heavily than others in this analysis. Only core subject classrooms with at least five days of assignments are rates on all grade-level assignments from classrooms with mostly students of colorSuccess rates on all grade-level assignments from classrooms with mostly white studentsSuccess rates on all grade-level assignments from classrooms with mostly white students56%65%4 EXECUTIVE SUMMARYIn short, students and their families have been deeply misled.