Transcription of Executive Summary World Robotics 2021 Industrial Robots
1 12 Executive Summary World Robotics 2021 Industrial Robots Executive Summary World Robotics 2021 Industrial Robots Robot installations 2020: Covid-19 pandemic, both a challenge and an opportunity Despite the global pandemic situation, robot installations grew slightly to 383,545 units. This represents a growth rate of almost and makes the year 2020 the third most successful year for the Robotics industry so far, following 2018 and 2017. The 10% drop in installations in 2019 reflected the difficult times the two main customer industries, automotive and electrical/electronics, experienced and the trade conflict between China and the United States. In 2020, the main growth driver was the electronics industry (29% of installations; +6 percentage points), which surpassed the automotive industry (21% of installations; -6 pp) as the largest customer of Industrial Robots .
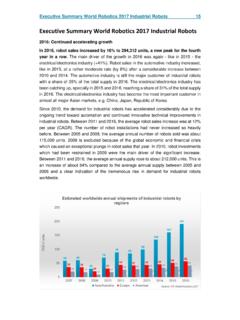
2 Metal and machinery (11%; -1 pp) followed, ahead of plastics and chemical products (5%) and food and beverages (3%). Note that for 22% of the Robots there is no information on the customer industry . In 2020, the operational stock of Industrial Robots was computed at 3,014,879 units (+10%). Since 2010, demand for Industrial Robots had risen considerably due to the ongoing trend towards automation and continued technological innovation in Industrial Robotics . From 2015 to 2020, annual installations increased by 9% on average each year (CAGR). Between 2005 and 2008, the average annual number of Robots sold was about 115,000 units, before the global economic and financial crisis caused robot installations to fall to just 60,000 units in 2009 with lots of investments being postponed.
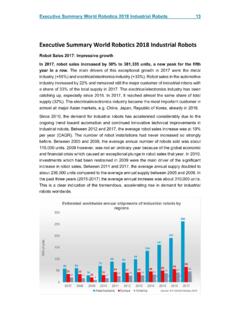
3 In 2010, investments increased and drove robot installations up to 120,000 units. By 2015, annual installations had more than doubled to almost 254,000 units. In 2016, the 300,000 installations per year mark was exceeded and in 2017, installations surged to almost 400,000 units. The 400,000 units per year mark was crossed for the first time in 2018. Growth in Asia, declining figures in Europe and in the Americas Asia2 is the World s largest Industrial robot market. In 2020, 266,452 units were installed, up 7% from 249,598 units in 2019. 71% of all newly deployed Robots were installed in Asia (2019: 67%). From 2015 to 2020, annual robot installations grew by 11% on average each year. The picture is uneven in the three largest Asian markets: Installations in China grew strongly (168,377 units; +20%), while the Japanese market (38,653 units; -23%) and the Korean market (30,506 units; -7%) struggled.
4 Robot installations in the second largest market, Europe, decreased by 8% to 67,700 units, down for the second year in a row from a peak of 75,560 units in 2018. Nevertheless, the annual average growth rate from 2015 to 2020 was +6%. Installation counts in Germany, the largest European market, remained almost constant at 22,302 units, while the second largest European market, Italy (8,525 units; -23%), and the third largest European market, 2 including Australia and New Zealand Executive Summary World Robotics 2021 Industrial Robots 13 France (5,368 units; -20%), dropped substantially. Both countries struggled a lot with the Covid-19 pandemic and had long periods of strict lockdown measures in the first half of 2020, severely impeding these economies.
5 In the Americas, installations dropped by 17% to 38,736 units in 2020. This, again, is down from a peak in 2018 (55,212 units). The number of Industrial robot installations is now back at its 2015 level (CAGR 2015-2020: +0%). The largest American market, the United States, has fared better (30,787 units; -8% in 2020) than the other major markets of Mexico (3,363 units; -26%) and Canada (2,566 units; -29%). 76% of global robot installations in five countries The five major markets for Industrial Robots are China, Japan, the United States, the Republic of Korea and Germany. These countries account for 76% of global robot installations. China has been the World s largest Industrial robot market since 2013 and accounted for 44% of total installations in 2020.
6 The 168,377 units installed in China exceeded the combined installations in Europe and the Americas (106,436 units) by 58%. For more details, see chapter In 2020, robot installations in Japan dropped roughly to the 2016 level. Installations were remarkably high in 2017, 2018, and 2019 for a country which already had a high level of automation in Industrial production. Even with the recent decline, the country still accounted for 10% of robot installations in 2020. For more details, see chapter The United States accounted for 8% of robot installations in 2020. The United States thus leapfrogged the Republic of Korea into third place with a record installation count of 40,373 units in 2018 and has since maintained this position.
7 For more details, see chapter In the Republic of Korea, annual robot installations had been declining since they reached a peak level of 41,373 units in 2016. In 2020, installations in Korea were just shy of the level of the United States and accounted for almost 8% of the grand total. For more details, see chapter Germany is the fifth largest robot market in the World , accounting for almost 6% of the global robot installations in 2020. For more details, see chapter Other important Asian markets Chinese Taipei ranked sixth in terms of annual robot installations from 2014 to 2018 before dropping to eighth in 2019. In 2020, this market ranked seventh with 7,373 units (+14%). Robot installations in Singapore depend to a large extent on the electronics industry , which in 2020 installed almost four times as many Robots as in the previous year.
8 This small country was the fifth largest Asian robot market in 2020 with 5,297 units (+132%) installed. Installations in India dropped by 25% to 3,215 units in 2020. The 14 Executive Summary World Robotics 2021 Industrial Robots market in Thailand moved sideways with another 2,885 units installed. Other Asian markets with more than 1,000 Industrial Robots installed in 2020 were Vietnam (1,880 units; -14%) and Malaysia (1,409 units; +18%). For more details, see chapter Other important European markets Spain is the tenth largest robot market in the World . Installations were down by 15% (3,387 units) in 2020, having peaked two years previously (5,266 units in 2018). Installations in the Nordic countries saw a 13% drop to 2,660 units, while those in Central and Eastern Europe fell by 17% to 8,283 units.
9 For more details, see chapter Other important markets in the Americas Robot installations in Brazil declined by 13% to 1,595 units. Compared to 2015, this implies an average annual growth rate of +3% (CAGR). Increasing robot installations in the electrical/electronics industry The electrical/electronics industry became the main customer of Industrial Robots in 2020. 109,315 Robots were installed in the production of household appliances, electrical machinery, semiconductors, solar panels, computers, telecommunication devices, and video and electronic entertainment goods. That is 23% more than the previous year and the second highest level ever recorded, following the peak level of 121,955 units in 2017. Since 2015, robot demand from this industry had grown by 11% per year on average.
10 In 2018 and 2019, global demand for electronic devices and components decreased 8985991341612002802832502664441434650566 7767468262830333841465547392011201220132 014201520162017201820192020 Annual installations of Industrial Robots ('000 of units)Asia/AustraliaEuropeThe Robotics 2021 Executive Summary World Robotics 2021 Industrial Robots 15 substantially. This customer industry was among the most affected businesses that suffered from the China-US trade conflict as Asian countries are leaders in the manufacture of electronic products and components. However, demand for consumer electronics skyrocketed during the Covid-19 pandemic and electronic components are crucial components in all kinds of engineering, including automotive and Industrial machinery.