Transcription of Experimental Modal Analysis - Sound and Vibration
1 1 Sound AND Vibration /JANUARY 2001 Often times, people ask some simple questions regardingmodal Analysis and how structures vibrate. Most times, it isimpossible to describe this simply and some of the basic un-derlying theory needs to be addressed in order to fully explainsome of these concepts. However, many times the theory is justa little too much to handle and some of the concepts can bedescribed without a rigorous mathematical treatment. Thisarticle will attempt to explain some concepts about how struc-tures vibrate and the use of some of the tools to solve struc-tural dynamic problems. The intent of this article is to sim-ply identify how structures vibrate from a nonmathematicalperspective. With this being said, let s start with the first ques-tion that is usually asked:In a nutshell, we could say that Modal Analysis is a processwhereby we describe a structure in terms of its natural char-acteristics which are the frequency, damping and mode shapes its dynamic properties.
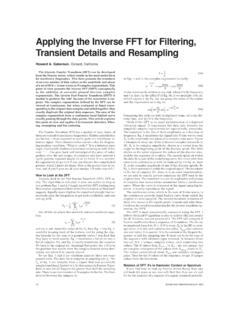
2 Well that s a mouthful so let s explainwhat that means. Without getting too technical, I often explainmodal Analysis in terms of the modes of Vibration of a simpleplate. This explanation is usually useful for engineers who arenew to vibrations and Modal s consider a freely supported flat plate (Figure 1). Let sapply a constant force to one corner of the plate. We usuallythink of a force in a static sense which would cause some staticdeformation in the plate. But here what I would like to do is toapply a force that varies in a sinusoidal fashion. Let s considera fixed frequency of oscillation of the constant force. We willchange the rate of oscillation of the frequency but the peak forcewill always be the same value only the rate of oscillation ofthe force will change. We will also measure the response of theplate due to the excitation with an accelerometer attached toone corner of the if we measure the response on the plate we will noticethat the amplitude changes as we change the rate of oscilla-tion of the input force (Figure 2).
3 There will be increases as wellas decreases in amplitude at different points as we sweep upin time. This seems very odd since we are applying a constantforce to the system yet the amplitude varies depending on therate of oscillation of the input force. But this is exactly whathappens the response amplifies as we apply a force with arate of oscillation that gets closer and closer to the natural fre-quency (or resonant frequency) of the system and reaches amaximum when the rate of oscillation is at the resonant fre-quency of the system. When you think about it, that s prettyamazing since I am applying the same peak force all the time only the rate of oscillation is changing!This time data provides very useful information. But if wetake the time data and transform it to the frequency domainusing the Fast Fourier Transform then we can compute some-thing called the frequency response function (Figure 3).
4 Nowthere are some very interesting items to note. We see that thereare peaks in this function which occur at the resonant frequen-cies of the system. And we notice that these peaks occur at fre-quencies where the time response was observed to have maxi-mum response corresponding to the rate of oscillation of theinput if we overlay the time trace with the frequency tracewhat we will notice is that the frequency of oscillation at thetime at which the time trace reaches its maximum value cor-responds to the frequency where peaks in the frequency re-sponse function reach a maximum (Figure 4). So you can seethat we can use either the time trace to determine the frequencyat which maximum amplitude increases occur or the frequencyresponse function to determine where these natural frequen-cies occur. Clearly the frequency response function is easierto people are amazed at how the structure has these natu-ral characteristics.
5 Well, what s more amazing is that the de-formation patterns at these natural frequencies also take ona variety of different shapes depending on which frequency isused for the excitation let s see what happens to the deformation pattern onthe structure at each one of these natural frequencies. Let splace 45 evenly distributed accelerometers on the plate andmeasure the amplitude of the response of the plate with dif-ferent excitation frequencies. If we were to dwell at each oneof the frequencies each one of the natural frequencies wewould see a deformation pattern that exists in the structure(Figure 5). The figure shows the deformation patterns that willresult when the excitation coincides with one of the naturalfrequencies of the system. We see that when we dwell at thefirst natural frequency, there is a first bending deformationpattern in the plate shown in blue (mode 1).
6 When we dwellat the second natural frequency, there is a first twisting defor-mation pattern in the plate shown in red (mode 2). When wedwell at the third and fourth natural frequencies, the secondbending and second twisting deformation patterns are seen ingreen (mode 3) and magenta (mode 4), respectively. These de-formation patterns are referred to as the mode shapes of thestructure. (That s not actually perfectly correct from a puremathematical standpoint but for the simple discussion here,these deformation patterns are very close to the mode shapes,from a practical standpoint.)These natural frequencies and mode shapes occur in allstructures that we design. Basically, there are characteristicsthat depend on the weight and stiffness of my structure whichdetermine where these natural frequencies and mode shapeswill exist. As a design engineer, I need to identify these fre-quencies and know how they might affect the response of mystructure when a force excites the structure.
7 Understanding themode shape and how the structure will vibrate when excitedhelps the design engineer to design better structures. Now thereis much more to it all but this is just a very simple explanationof Modal , basically, Modal Analysis is the study of the natural char-acteristics of structures. Understanding both the natural fre-quency and mode shape helps to design my structural systemfor noise and Vibration applications. We use Modal Analysis tohelp design all types of structures including automotive struc-tures, aircraft structures, spacecraft, computers, tennis rackets,golf clubs .. the list just goes on and we have introduced this measurement called a fre-quency response function but exactly what is it? The frequency response function is very simply the ratio ofthe output response of a structure due to an applied force. Wemeasure both the applied force and the response of the struc-ture due to the applied force simultaneously.
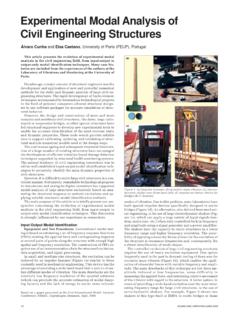
8 (The response canbe measured as displacement, velocity or acceleration.) NowExperimental Modal AnalysisA Simple Non-Mathematical PresentationPeter Avitabile, University of Massachusetts Lowell, Lowell, MassachusettsCould you explain Modal Analysis for me?Just what are these measurementsthat are called FRFs?2 Sound AND Vibration /JANUARY 2001the measured time data is transformed from the time domainto the frequency domain using a Fast Fourier Transform algo-rithm found in any signal processing analyzer and computersoftware to this transformation, the functions end up being com-plex valued numbers; the functions contain real and imaginarycomponents or magnitude and phase components to describethe function. So let s take a look at what some of the functionsmight look like and try to determine how Modal data can beextracted from these measured s first evaluate a simple beam with only 3 measurementlocations (Figure 6).
9 Notice that the beam has 3 measurementlocations and 3 mode shapes. There are 3 possible places thatforces can be applied and 3 possible places where the responsescan be measured. This means that there are a total of 9 pos-sible complex-valued frequency response functions that couldbe acquired; the frequency response functions are usually de-scribed with subscripts to denote the input and output loca-tions as hout,in (or with respect to typical matrix notation thiswould be hrow,column).Figure 7 shows the magnitude, phase, real and imaginaryparts of the frequency response function matrix. (Of course, Iam assuming that we remember that a complex number is madeup of a real and imaginary part which can be easily convertedto magnitude and phase. Since the frequency response is acomplex number, we can look at any and all of the parts thatcan describe the frequency response function.)Now let s take a look at each of the measurements and makesome remarks on some of the individual measurements thatcould be made.
10 First let s drive the beam with a force from animpact at the tip of the beam at point 3 and measure the re-sponse of the beam at the same location (Figure 8). This mea-surement is referred to as h33. This is a special measurementreferred to as a drive point measurement. Some important char-acteristics of a drive point measurement are: All resonances (peaks) are separated by anti-resonances. The phase loses 180 degrees of phase as we pass over a reso-nance and gains 180 degrees of phase as we pass over an anti-resonance. The peaks in the imaginary part of the frequency responsefunction must all point in the same as I continue and take a measurement by moving theimpact force to point 2 and measuring the response at point 3and then moving the impact force on to point 1 to acquire twomore measurements as shown. (And of course I could continueon to collect any or all of the additional input-output combi-nations.)