Transcription of Fact Sheet MFS Growth Fund
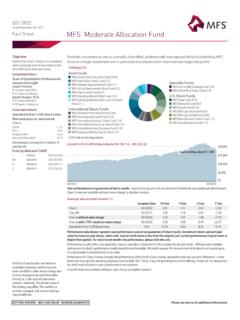
1 MFS Growth FundFact SheetQ4 | 2021As of December 31, 2021 ObjectiveSeeks capital teamPortfolio ManagersEric Fischman, CFA 22 years with MFS 31 years in industryPaul Gordon 18 years with MFS 22 years in industryBradford Mak 11 years with MFS 17 years in industryFund benchmarkRussell 1000 Growth IndexRisk measures vs. benchmark (Class I) Ratio1. 37 Standard Deviation13. 5 3 Risk measures are based on a trailing 10 year Symbol and CUSIPIMFEIX552985863R6 MFEKX552985673 AMFEGX552 9 8 5103 CMFECX552985889 Top 10 holdingsMICROSOFT CORPALPHABET INC (EQ)APPLE INCADOBE INCNVIDIA CORPMETA PLATFORMS INCINTUIT INCMASTERCARD INC (EQ)DANAHER CORP (EQ) of total net assetsAverage annual total returns (%)Inception Date10 Year5 Year3 Year1 YearClass I01/02 R608/26 A without sales charge09/13 A with maximum sales charge09/13/9318.
2 7. 9 1000 Growth 7. 6 0 Performance data shown represent past performance and are no guarantee of future results. Investment return and principal value fluctuate so your shares, when sold, may be worth more or less than the original cost; current performance may be lower or higher than quoted. For most recent month-end performance, please visit results reflect any applicable expense subsidies and waivers in effect during the periods shown. Without such subsidies and waivers the fund's performance results would be less favorable. All results assume the reinvestment of dividends and capital gains.
3 It is not possible to invest directly in an for Class R shares includes the performance of the fund's Class I shares, adjusted to take into account differences in sales loads and class-specific operating expenses (such as Rule 12b-1 fees), if any, for periods prior to their offering. Please see the prospectus for additional information about performance and R6 shares are available without a sales charge to eligible FDIC INSURED - MAY LOSE VALUE - NO BANK GUARANTEEP lease see reverse for additional information.$0$10,000$20,000$30,000$40,0 00$50,000 Growth of $10,000 Class I shares 12/31/11 12/31/2112/31/1112/31/21 Class I ending value $57,713 Past performance is no guarantee of future results.
4 Fund returns assume the reinvestment of dividends and capital gain distributions. Class I shares are available without a sales charge to eligible fund seeks companies whose duration of Growth potential we believe is underappreciated by the market. Emphasis is placed on high-quality, above-average businesses with pricing power and free cash flow Technology ( )Communica-tion Services ( )Health Care ( )Consumer Discretionary ( )Industrials ( )Financials ( )Materials ( )Consumer Staples ( )Real Estate ( )Cash & Cash Equivalents ( )Sectors (%)Before investing, consider the fund's investment objectives, risks, charges, and expenses.
5 For a prospectus, or summary prospectus, containing this and other information, contact your investment professional or view online at Please read it Sheet | Q4 | 2021 MFS Growth YEAR TOTAL RETURNS (%)'12'13'14'15'16'17'18'19'20'21 Class I17. 3 3 7. 6 1000 Growth Index15. 0 7. 6 0 Past performance is no guarantee of future EXPENSES (%)Class IClass R6 Class AGross Expense Expense Expense Ratio is the fund's total operating expense ratio from the fund's most recent prospectus. Net Expense Ratio reflects the reduction of expenses from contractual fee waivers and reimbursements.
6 Elimination of these reductions will result in higher expenses and lower DATAI nception Date12/29/86 Net Assets$ billionNumber of Issues74 Market Cap (weighted avg.)$ billionPrice/Book (weighted avg.)10 .1 Price/Earnings (12 months forward weighted avg.) Ratio13%Important risk considerationsThe fund may not achieve its objective and/or you could lose money on your investment in the fund. n Stock: Stock markets and investments in individual stocks are volatile and can decline significantly in response to or investor perception of, issuer, market, economic, industry, political, regulatory, geopolitical, environmental, public health, and other conditions.
7 N Growth : Investments in Growth companies can be more sensitive to the company's earnings and more volatile than the stock market in general. n Please see the prospectus for further information on these and other risk and vendor disclosuresRussell 1000 Growth Index - constructed to provide a comprehensive barometer for Growth securities in the large-cap segment of the equity universe. Companies in this index generally have higher price-to-book ratios and higher forecasted Growth Russell Company ("Russell") is the source and owner of the Russell Index data contained or reflected in this material and all trademarks, service marks and copyrights related to the Russell Indexes.
8 Russell is a trademark of Frank Russell Company. Neither Russell nor its licensors accept any liability for any errors or omissions in the Russell Indexes and/or Russell ratings or underlying data and no party may rely on any Russell Indexes and/or Russell ratings and/or underlying data contained in this communication. No further distribution of Russell Data is permitted without Russell's express written consent. Russell does not promote, sponsor or endorse the content of this Global Industry Classification Standard (GICS ) was developed by and/or is the exclusive property of MSCI, Inc.
9 And S&P Global Market Intelligence Inc. ("S&P Global Market Intelligence"). GICS is a service mark of MSCI and S&P Global Market Intelligence and has been licensed for use by MFS. MFS has applied its own internal sector/industry classification methodology for equity securities and non-equity securities that are unclassified by is a measure of the portfolio's risk-adjusted performance. When compared to the portfolio's beta, a positive alpha indicates better-than-expected portfolio performance and a negative indicates alpha worse-than-expected portfolio is a measure of the volatility of a portfolio relative to the overall market.
10 A beta less than indicates lower risk than the market; a beta greater than indicates higher risk than the market. It is most reliable as a risk measure when the return fluctuations of the portfolio are highly correlated with the return fluctuations of the index chosen to represent the Ratio is a risk-adjusted measure calculated to determine reward per unit of risk. It uses a standard deviation and excess return. The higher the Sharpe Ratio, the better the portfolio's historical risk-adjusted Deviation is an indicator of the portfolio's total return volatility, which is based on a minimum of 36 monthly returns.