Transcription of Fact Sheet S&P 500 SPY Equity ETF Trust As of 12/31/2021
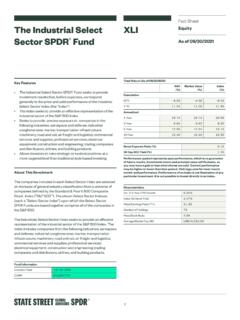
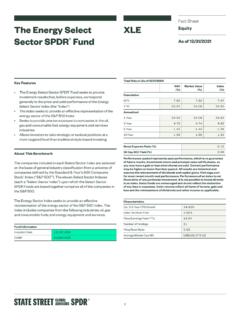
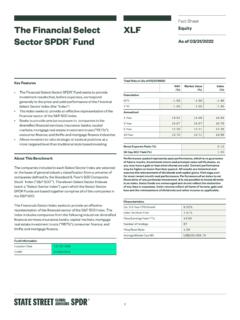
1 SPDR S&P 500 ETF TrustSPY fact SheetEquity As of 06/30/2022 Key Features The SPDR S&P 500 ETF Trust seeks to provide investment results that, before expenses, correspond generally to the price and yield performance of the S&P 500 Index (the Index ) The S&P 500 Index is a diversified large cap index that holds companies across all eleven GICS sectors Launched in January 1993, SPY was the very first exchange traded fund listed in the United StatesAbout This BenchmarkThe S&P 500 Index is composed of selected stocks from five hundred (500) issuers, all of which are listed on national stock exchanges and spans over approximately 24 separate industry InformationInception Date01/22/1993 CUSIP78462F103 Total Return (As of 06/30/2022) N AV(%)Market Value(%)Index(%)Cumulative 1 Gross Expense Ratio (%) Expense Ratio (%) Day SEC Yield (%) performance is not a reliable indicator of future performance.
2 Investment return and principal value will fluctuate, so you may have a gain or loss when shares are sold. Current performance may be higher or lower than that quoted. All results are historical and assume the reinvestment of dividends and capital gains. Visit for most recent month-end performance. Performance is shown net of fees. Performance of an index is not illustrative of any particular investment. It is not possible to invest directly in an index. Index returns are unmanaged and do not reflect the deduction of any fees or expenses. Index returns reflect all items of income, gain and loss and the reinvestment of dividends and other income as 3-5 Year EPS Dividend Ratio of Holdings504 Price/Book Market Cap (M)US$510, 1 Top 10 Holdings Weight (%)Apple Inc. Class Inc. Class Hathaway Inc. Class Group & Subject to may not equal 100 due to SectorsWeight (%)Information Classification: General State Street Global AdvisorsOne Iron Street, Boston MA 02210T: +1 866 787 2257 Glossary NAV The market value of a mutual fund s or ETFs total assets, minus liabilities, divided by the number of shares outstanding.
3 Market Value Determined by the midpoint between the bid/offer prices as of the closing time of the New York Stock Exchange (typically 4:00PM EST) on business days. Gross Expense Ratio The fund s total annual operating expense ratio. It is gross of any fee waivers or expense reimbursements. It can be found in the fund s most recent prospectus. 30 Day SEC Yield (Also known as Standardized Yield) An annualized yield that is calculated by dividing the net investment income earned by the fund over the most recent 30-day period by the current maximum offering price. Est. 3-5 Year EPS Growth Based on the underlying holdings of the fund. The actual earnings estimates for the underlying holdings are provided by FactSet, First Call, I/B/E/S Consensus, and Reuters and are used to calculate a mean 3-5 year EPS growth rate estimate. Index Dividend Yield The weighted average of the underlyings indicated annual dividend divided by price, expressed as a percentage.
4 Price/Earnings Ratio FY1 The weighted harmonic average of current share price divided by the forecasted one year earnings per share for each security in the fund. Negative and positive outliers are included in the calculation. Price/Book Ratio The weighted harmonic average of closing market price divided by the most recent reported book value for each security in the fund s portfolio as calculated for the last twelve months. Important Risk InformationWeights are as of the date indicated, are subject to change, and should not be relied upon as current involves risk including the risk of loss of information provided does not constitute investment advice and it should not be relied on as such. It should not be considered a solicitation to buy or an offer to sell a security. It does not take into account any investor's particular investment objectives, strategies, tax status or investment horizon. You should consult your tax and financial whole or any part of this work may not be reproduced, copied or transmitted or any of its contents disclosed to third parties without SSGA s express written communication is not intended to be an investment recommendation or investment advice and should not be relied upon as Fund's investments are subject to changes in general economic conditions, general market fluctuations and the risks inherent in investment in securities markets.
5 Investment markets can be volatile and prices of investments can change substantially due to various factors including, but not limited to, economic growth or recession, changes in interest rates, changes in the actual or perceived creditworthiness of issuers, and general market liquidity. The Fund is subject to the risk that geopolitical events will disrupt securities markets and adversely affect global economies and markets. Local, regional or global events such as war, acts of terrorism, the spread of infectious illness or other public health issues, or other events could have a significant impact on the Fund and its securities may fluctuate in value in response to the activities of individual companies and general market and economic the shares of ETFs are tradable on secondary markets, they may not readily trade in all market conditions and may trade at significant discounts in periods of market trade like stocks, are subject to investment risk, fluctuate in market value and may trade at prices above or below the ETFs net asset value.
6 Brokerage commissions and ETF expenses will reduce Property Information: Standard & Poor s , S&P and SPDR are registered trademarks of Standard & Poor s Financial Services LLC (S Dow Jones is a registered trademark of Dow Jones Trademark Holdings LLC (Dow Jones); and these trademarks have been licensed for use by S&P Dow Jones Indices LLC (SPDJI) and sublicensed for certain purposes by State Street Corporation. State Street Corporation s financial products are not sponsored, endorsed, sold or promoted by SPDJI, Dow Jones, S&P, their respective affiliates and third party licensors and none of such parties make any representation regarding the advisability of investing in such product(s) nor do they have any liability in relation thereto, including for any errors, omissions, or interruptions of any State Street Global Advisors Funds Distributors, LLC, member FINRA, SIPC, an indirect wholly owned subsidiary of State Street Corporation.)
7 References to State Street may include State Street Corporation and its affiliates. Certain State Street affiliates provide services and receive fees from the SPDR ETFs. ALPS Distributors, Inc., member FINRA, is the distributor for DIA, MDY and SPY, all unit investment trusts. ALPS Portfolio Solutions Distributor, Inc., member FINRA, is the distributor for Select Sector SPDRs. ALPS Distributors, Inc. and ALPS Portfolio Solutions Distributor, Inc. are not affiliated with State Street Global Advisors Funds Distributors, investing, consider the funds investment objectives, risks, charges and expenses. To obtain a prospectus or summary prospectus which contains this and other information, call 1-866-787-2257 or visit Read it FDIC InsuredNo Bank GuaranteeMay Lose Value 2022 State Street Rights # SPD002759 Tracking Number: Date: 10/31/2022 ETF-SPY 20220712/15:00