Transcription of Factors Affecting Health Visitor Workload - hcaf.biz
1 Supporting your commitment to excellence Dr Rod Jones (2009) Page 1 of 6 Factors Affecting Health Visitor Workload Dr Rod Jones (ACMA) Statistical Advisor Healthcare Analysis & Forecasting, Camberley, UK +44 (0)1276 21061 Summary Health Visitor caseload varies considerably from a minimum of 140 families per WTE to more than 400 families per WTE. Equalisation of caseload is required. The Workload within a caseload is determined by the random occurrence of families with varying levels of dependency. At Health Visitor level the effect of randomness is far higher than adjustments due to deprivation. Recommendations Health Visitor caseloads should not be organised on a GP list basis. Higher dependency families should be shared across Health visitors . Health visitors will need to be shared between GP practices to balance Workload . Allocation of Health visitors should be based on measured Workload rather than deprivation scores.
2 Introduction When seeking to understand Health Visitor Workload it is common to think in terms of Deprivation Indices such as Jarman or the more recent index of multiple deprivation (IMD) developed by the DETR. These indices are valuable in adjusting the overall average Workload . For example, on average a deprivation index of 120 means that a Health Visitor caseload of 100 families is equivalent to a caseload of 120 families where the deprivation index is only 100. Please note the extensive use of the word average because it is at this point that the deprivation index-based approach breaks down simply because there is no such thing as an average caseload. Deprivation indices are themselves derived from very large samples of the total combined Health Visitor Workload for hundreds of practices. There is usually Supporting your commitment to excellence Dr Rod Jones (2009) Page 2 of 6 considerable scatter in the data; hence the need for results from a large number of practices, and some form of statistical correlation is then used to determine the average Workload as per the deprivation index.
3 Always remember that there is considerable scatter in the data, most practices are somewhere other than the average. The reason they are somewhere other than at the average is to do with something called Poisson Randomness. Poisson Randomness Poisson randomness is the randomness associated with most everyday events such as, cars arriving at a motorway exit, customers arriving at a supermarket, GP referrals to a consultant, number of different category clients in a Health Visitor caseload, etc. Once we know the expected average ( Workload from a deprivation index) Poisson randomness then tells us the scatter around the average. For example, in the recent survey of Health Visitor Workload conducted by the Health Visiting Professional Practice Group we can see that the average number of families on the child protection register is per 100 families. The data in all categories is consistent with Poisson randomness, at Health Visitor level no effect can be discerned due to deprivation.
4 Poisson randomness tells us that if any Health Visitor has a caseload of 100 families they can have anywhere between 0 and 4 families on the child protection register. Poisson randomness also tells us that 81% of Health visitors will have none, 17% will have one, will have two, will have three and will have four client families. We see that most Health visitors (thankfully) have no families in this category but some poor soul could be struggling with 4 families. Remember in all of this the average is per 100 families a figure that does not directly apply to any Health Visitor since you can only have whole numbers of client families. There is an important point here at the level of a single Health Visitor it is randomness in the client mix that determines the Workload NOT the deprivation index. This is because a Health Visitor caseload is too small for a deprivation weighting of 20% to have any measurable impact in the face of a relative contribution from randomness of greater than 200%.
5 At the level of a single practice it is still randomness that determines the Workload rather than any deprivation index. It is only at PCG level that the deprivation index starts to apply and then only for approximate comparison between PCG s. For example, with a deprivation index of 120 a whole PCG could be said to need an average of 20% more Health visitors than one with a score of 100. However, within each PCG the allocation of resources is driven by randomness. This leads us to a very important conclusion, namely, allocation of resources within a PCG should be suited to the actual Workload needs of each practice determined by measurement and not from theoretical deprivation scores. Supporting your commitment to excellence Dr Rod Jones (2009) Page 3 of 6 Within a single practice the role of randomness suggests that caseload should be shared on the basis of Workload and not on the basis of GP lists.
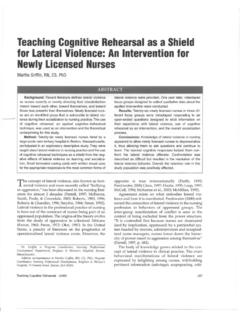
6 For a single GP practice the Health Visitor input will have to be shared with nearby practices. Results Gross Caseload per WTE varies considerably. The following variation can be observed: Table One: Variation in Health Visitor caseload (families per WTE) Measure Value Comment Average 290 Median 280 Middle value Mode 260 Most common value Maximum 750 Minimum 140 This is illustrated in Figure One where it can be seen that the average is high due to a large proportion of Health visitors with a caseload higher than the mode (most common value). It is fairly obvious that some equalisation of gross Workload is required. Figure One: Health Visitor caseload 024681012131 -170171 -200201 -230231 -250251 -260261 -270271 -290291 -310311 -340341 -390391 -450451-550551 -650651 -750 Families per WTE Supporting your commitment to excellence Dr Rod Jones (2009) Page 4 of 6 While total caseload is an important contributor to total Health Visitor Workload the dependency of the families on the caseload will also have an important role to play.
7 Table One summarizes the results of the survey of 19,225 families. Table One: Average incidence per caseload of 100 families 1 Family Category Nature of Concern Child Protection Family Support Cause for Concern High Dependency Child Development & Parenting Mental Health & Substance Abuse Social Circumstances Family Violence Total 2 As can be seen the category of High Dependency constitutes the highest overall incidence with an average of families per 100 families. The incidence of most categories increases from left to right across the table. The only exception is family violence which has its highest incidence in the Cause for Concern category. The range in number of each category for a Health Visitor can be calculated as follows. First calculate expected average, where Expected average (EA) = Caseload x incidence 100 Maximum possible = EA + 3 x square root of EA Minimum possible = EA 3 x square root of EA (ignore any value less than zero) For example, a Health Visitor has a caseload of 350 families.
8 The incidence of high dependency families is per 100 families; therefore, the expected average is x = families in 350 families. The square root of is (the standard deviation around the average for a Poisson distribution is always equal to the square root of the average number) and 3-times the square root is Therefore the minimum and maximum possible will be (round up to 2) and (round to 22) families respectively. 1 Data is from the survey conducted by the Health Visiting Professional Practice Group and covers some 19,225 families from West Berkshire and South Oxfordshire PCG s. 2 Note that the total does not equal the sum of each category since a single family can fall into more than one category. Supporting your commitment to excellence Dr Rod Jones (2009) Page 5 of 6 Hence due to simple randomness any Health Visitor with a caseload of 350 families could expect to have somewhere between 2 and 22 high dependency families.
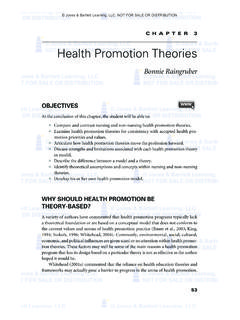
9 This large variation in number is driven by randomness and not by deprivation. An affluent high dependency family may need less input than a deprived high dependency family, although, this does not hold true in all cases. Evidence for non-random Workload Evidence for a non-random Workload can be derived from any data points lying outside the maximum and minimum predicted from randomness. This is illustrated in the following chart that gives data for families on the child protection register. The two points at high caseload come from two large practices. All other data is for individual Health visitors . Note that a minimum possible count of zero applies to all caseloads up to 4,800, the equivalent caseload of three large practices with up to 15 Health visitors . In this chart only one Health Visitor has a Workload outside of that predicted from randomness, although in this case 3 is also a statistically possible outcome having a likelihood of occurrence.
10 Families on the Child Protection Register01234567891011020040060080010001 2001400160018002000 CaseloadFamilies per Health Visitor orpracticeMaximum possible due torandomness A review of the other categories likewise gives only a few practices outside the maximum and minimum possible limits (refer to the attached charts). In the case of the two categories High Dependency and Cause for Concern the classification of families into these groups appear to be different between different Health visitors . Hence one Health Visitor will tend to label the majority as High Dependency while another will label the majority as Cause for Concern . Adjusting for this polarization in assigning families to each category removes most instances of numbers higher than predicted from randomness. Supporting your commitment to excellence Dr Rod Jones (2009) Page 6 of 6 To avoid any possible bias due to assignment of families into categories all four higher dependency categories were added together to give a total number of families leading to a higher Workload .