Transcription of Facts and Figures on E-Waste and Recycling
1 Facts and Figures on E-Waste and Recycling This is a summary of available statistics that help is to quantify the problems of electronic waste and E-Waste Recycling efforts. Each item includes its source and link to the original documents (where available), to make it easy for reporters and researchers to confirm data back to the original source. We assembled these statistics primarily for media and for legislators and advocates of E-Waste policies. This content gets updated regularly as new statistics are released. If you have come across statistics we should add to this, please send them to us at info (at) etakeback dot org.
2 Contents Topic Page How much E-Waste is being discarded trashed or 2. recycled? How much E-Waste gets stockpiled or stored? 3. Sales of electronics how much are we buying? 4. Computers Televisions Cell Phones All consumer electronics Resource recovery from electronics Recycling 6. Resources used in electronics (energy, water, etc) 7. E-Waste Facts and Figures June 25, 2014. How Much E-Waste Do We Generate? Whether trashed or recycled, what are we getting rid of each year in the (See next section for what we stockpile.)
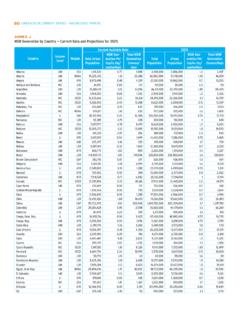
3 E-Waste by the Ton in 2010 Was it Trashed or Recycled (According to the EPA). Products Total Trashed Recycled Recycling Rate disposed**. tons tons tons %. Computers 423,000 255,000 168,000 40%. Monitors 595,000 401,000 194,000 33%. Hard copy devices 290,000 193,000 97,000 33%. Keyboards and Mice 67,800 61,400 6,460 10%. Televisions 1,040 864,000 181,000 17%. Mobile devices 19,500 17,200 2,240 11%. TV peripherals* Not included Not included Not included Not included Total (in tons) 2,440,000 1,790,000 649,000 27%. E-Waste by the UNIT in 2010 Was it Trashed or Recycled (Same report as above, but reported in UNITs, not by TONS).
4 Products Total Trashed Recycled Recycling Rate disposed**. Units Units Units %. Computers 51,900,000 31,300,000 20,600,000 40%. Monitors 35,800,000 24,100,000 11,700,000 33%. Hard copy devices 33,600,000 22,400,000 11,200,000 33%. Keyboards and Mice 82,200,000 74,400,000 7,830,000 10%. Televisions 28,500,000 23,600,000 4,940,000 17%. Mobile devices 152,000,000 135,000,000 17,400,000 11%. TV peripherals* Not included Not included Not included Not included Total (in units_ 384,000,000 310,000,000 73,700,000 19%. What's included here?)
5 Computer products include CPUs, desktops and portables. Hard copy devices are printers, digital copiers, scanners, multi-functions and faxes. Mobile devices are cell phones, personal digital assistants (PDAs), smartphones, and pagers *Study did not include a large category of E-Waste : TV peripherals, such as VCRs, DVD players, DVRs, cable/satellite receivers, converter boxes, game consoles. ** Disposed means going into trash or Recycling . These totals don't include products that are no longer used, but which are still stored in homes and offices.
6 1. Source: EPA. 1. Electronics Waste Management in the United States Through 2009, EPA, May 2011, EPA 530-R-11-002. Electronics TakeBack Coalition Page 2 E-Waste Facts and Figures June 25, 2014. How much E-Waste do we generate? Continued In 2010, we ( ) got rid of: The EPA's most recent E-Waste report (summarized in the table on 384 million UNITS of E-Waste the previous page) shows that we got rid of (we trashed or 152 million mobile devices recycled) 142,000 computers and over 416,000 mobile devices EVERY DAY!! We generated over million tons of In 2012, we generated million tons of E-Waste in the Of E-Waste in the in 2012 this amount, only 1 million tons or % was recycled, according to the EPA (up from 25% in 2011).
7 The rest was trashed in 2. landfills or incinerators. Also see Figure 1, below. Discarded Electronics Worldwide: Some 20 to 50 million metric tonnes of E-Waste are generated 20 to 50 million metric tons of E-Waste worldwide every year, comprising more than 5% of all municipal disposed worldwide each year solid waste. When the millions of computers purchased around the world every year (183 million in 2004) become obsolete they leave behind lead, cadmium, mercury and other hazardous 3. wastes.. iPad 5 release drives consumers to give Release of iPad 5 greated surge of tablet trade ins up their old but working tablets Consumers are trading in their iPads and other tablets at an "unprecedented rate" to buy the newest offerings from Apple, Google and Microsoft, according to SellCell, an electronics trade-in website.
8 Figure 1: EPA data from Municipal Solid Waste Generation, Recycling and Disposal in the United States, 2012 , Feb 2014; These EPA numbers are for selected consumer electronics which include products such as TVs, VCRs, DVD players, video cameras, stereo systems, telephones, and computer equipment. 2. Municipal Solid Waste Generation, Recycling and Disposal in the United States; Tables and Figures for 2012, US EPA, Feb 2014, tables 12 - 14. 3. Press Release, Basel Conference Addresses Electronic Wastes Challenge. November 27, 2006, United Nations Environment Programme (UNEP).
9 Available at: Electronics TakeBack Coalition Page 3 E-Waste Facts and Figures June 25, 2014. Sales in Electronics - How Much Electronics Are We Buying? Note: Statistics on sales are expressed in terms of units shipped from the manufacturers into their various sales channels, unless otherwise noted. US Sales Global Sales What we What we What we What we What we What we Future bought in bought in will buy bought in bought in will buy in Year 2012 2013 in 2014 2012 2013 2014 Projection Computers Computer PCs: million million 341 million 299 million 277 million 268million Desktop Laptop, Gartner qrtr Gartner qr Gartner Gartner Gartner PCs in 2015.
10 But not tablets reports reports Gartner Tablets incl million million million 315 million 455 million e-readers tablets CEA million Gartner million Display- in 2015. $29 billion CEA Gartner search Display- CEA search Other ultra million 17 million 39 million 63 million mobile computers Gartner Gartner Gartner in 2015. Gartner Servers million Gartner Televisions All million million 39 million million Televisions TVs TVs LCD TVs iSuppli million by iSuppli iSuppli CEA 2015. iSuppli Smart TVs 66 million 2015: 141. (connected) iSuppli million iSuppli Streaming set top 2 million 4 million million devices iSuppli iSuppli in 2015.