Transcription of FALLS PREVENTION TOOLKIT
1 NORTHERN IRELAND. NURSING HOME. REGIONAL COLLABORATIVE. FALLS PREVENTION . TOOLKIT . January 2013. NH Collaborative RP/01/13/ver 1/3. CONTENTS PAGE NUMBER. 1. Background to improvement work 3. 2. First area for Improvement: preventing FALLS 3. 3. Benefits to preventing FALLS 3. 4. Improvement Methodology 3-6. 5. Aim for improvement work 7. RESOURCE SECTION 7-36. - Driver Diagram 9-13. - Risk Assessments: Example 1: Therapy Risk Assessment 14-15. Example 2 16-18. - Post fall Review Template 19-22. - PREVENTION of FALLS , Flowchart 23. - Safety Cross/Calendar 24. - FALLS Safety Stick 25. - Safety Briefings 26-27. - Intentional Rounding 28-31. - Information Leaflets: Medicines Associated with FALLS 32. Footwear Information Leaflet for residents, families and staff 33-34. - Audit Tools 35-37. Comments from Participating Homes 38. Notes 39. 1. Background In 2011, the Northern Ireland (NI) HSC Safety Forum (SF), identified nursing homes as a priority for improvement work.
2 Nursing homes with more than 20 beds were asked for expressions of interest and to suggest areas/topics for improvement. Eight of 16. applicants were selected (based on case mix, geography, perceived ability to deliver). for the first community-based regional quality and safety collaborative in NI. 2. First Area for Improvement Work: PREVENTION of FALLS Through meetings with key stakeholders and researching the evidence, the PREVENTION of FALLS was chosen as the first area for improvement work with the Nursing Homes. Annually 35% people aged 65 years and over experience a fall ; this increases to 45%. in those aged 80 years and over. There is a higher prevalence of FALLS in care homes and community. This higher prevalence of older people at risk of falling is due to increased incidence of confusion, confounding medical conditions and environmental factors.
3 It is estimated that costs associated with FALLS are more than billion per year to the NHS as well as impacting on the lives of older people. FALLS can be complex and there is no single measure that reduces FALLS . A range of interventions need to be co-ordinated and to respond to each resident's risk. 3. Benefits of FALLS PREVENTION : Reducing the severity of harm and number of FALLS that result in an emergency department visit Improved work practices by ensuring early identification of residents at high risk for FALLS and the carrying out of post- fall assessments Improved interdisciplinary team approaches to care and improved staff awareness of evidence based practices Improved resident-centred care approach 4. Improvement Methodology The Model for Improvement is a simple yet powerful tool for accelerating improvement which is successfully utilised in improvement work internationally.
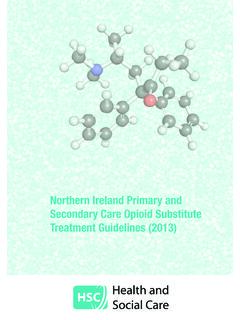
4 3. It is made up of a set of fundamental questions that drive all improvement and the PLAN-DO-STUDY-ACT cycle The Model is pragmatic and oriented towards experiential learning as it addresses three key improvement questions (see Fig 1) associated with setting aims, establishing measures, and selecting changes. Chosen changes are tested on a small scale using PDSA (Plan, Do, Study, Act) cycles. Testing, implementation and spread: it is crucial to run sequential tests under different conditions (using the PDSA Cycle to document learning) before the change (s) is implemented in the pilot unit/population and only after successful implementation in the pilot unit/population should spread be attempted in other parts of the organisation . there are logical steps along the road to improvement and this path is based on a sequence that works. Implementation and spread also require use of the PDSA cycle.
5 THE MODEL FOR IMPROVEMENT. 4. Setting Aims Improvement work requires the setting of an aim(s). The aim should be time- specific and measurable; it should also define the specific population of patients or other system that will be affected. It must include: How much, by When? In the case of the FALLS PREVENTION work in this Collaborative, there were 2 aims: I. Regional aim of: We will achieve a 25% reduction in the FALLS rate (per 1,000 bed days) in Nursing Home A by December 2012. II. Individual Homes: We will aim to achieve 45 days between FALLS on Floor B of Nursing Home. Establishing Measures Teams use quantitative measures to determine if a specific change actually leads to an improvement. Selecting Changes Ideas for change may come from the insights of those who work in the system, from change concepts or other creative thinking techniques, or by borrowing from the experience of others who have successfully improved.
6 Testing Changes The Plan-Do-Study-Act (PDSA) cycle is shorthand for testing a change in the real work setting by planning it, trying it, observing the results, and acting on what is learned. This is the scientific method adapted for action-oriented learning. Implementing Changes After testing a change on a small scale, learning from each test, and refining the change through several PDSA cycles, the team may implement the change on a broader scale for example, for an entire pilot population or on an entire unit or organisation 5. Spreading Changes After successful implementation of a change or package of changes for a pilot population or an entire unit, the team can spread the changes to other parts of the organization or in other organizations. Measurement Measurement doesn't have to be difficult or time-consuming but it is important to define exactly what you plan to measure.
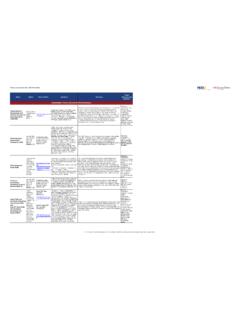
7 For this collaborative, the key question was what will we count as a fall (see definition on page 7). The Key is to pick the right measures, so you can see results quickly and adapt your interventions. Measurement should show us: How the current process is performing How much variation there is in the process Have changes resulted in improvement Have the changes been sustained Whether we have reached our goal When collecting data, create data collection forms that include only the information you need and are easy to fill out. Plot data, for your measures, over time. This data can be displayed on run charts. These are easy to construct and simple to interpret and can help you answer the points above. Example of a Run Chart (basic). 6. 5. AIM. As discussed in Section , the definition of a fall was agreed by those participating in the Collaborative and is outlined below: An event whereby and individual comes to rest on the ground or another level with or without loss of consciousness.
8 Nice 2004 . The overall aim for this work was: To improve care for residents in the Nursing Home environment Focusing on the PREVENTION of FALLS in the first instance, a number of key objectives were identified to meet this aim: to achieve a reduction of 25% in the rate of FALLS by December 2012;. to achieve 45 days or greater between FALLS by December 2012;. to ensure 95% compliance with FALLS risk assessment on admission, at monthly review and to ensure a post- fall review is carried out, where relevant, for residents who sustain a fall ;. to develop capacity in quality improvement within the nursing homes and expand the improvement to the other areas identified at project start Driver Diagram A Driver Diagram was developed for the collaborative (pages9-13). A driver diagram helps to focus on the cause and effect relationships that exist in complex situations.
9 It provides a simple way to break down improvement aims into well defined drivers that can then form the focus of improvement efforts. It includes: The aim or goal of the improvement effort The drivers are the main influences which contribute directly to the chosen goal or aim The interventions are specific actions you can take that will affect these drivers The relationship arrows show the connections between drivers and interventions. A single - intervention may impact upon a number of drivers. 7. RESOURCES. 8. 9. 10. 11. 12. Additional Reference, Social Care Scotland Improvement 13. RISK ASSESSMENT, Example 1: Therapy FALLS Risk Assessment: Page 1. 14. Risk Assessment, Example 1: Therapy FALLS Risk Assessment, Page 2. 15. Risk Assessment, Example 2: Page 1. 16. Risk Assessment, Example 2: Page 2. 17. Risk Assessment, Example 2: Page 3 (final page). 18.
10 Post FALLS Review Template: Page 1. 19. Post FALLS Review Template: Page 2. 20. Post FALLS Review Template: Page 3. 21. Post FALLS Review Template: Page 4. 22. PREVENTION of FALLS , Flow Chart 23. SAFETY CROSS/CALENDAR. 24. FALLS SAFETY STICK. 25. SAFETY BRIEFINGS. These are a simple, easy to use tool that frontline staff can use to share information about potential resident safety problems and concerns on a daily basis. They help increase staff awareness of patient safety issues and create an environment in which staff share information openly and make resident safety an integral part of daily work. 1. Getting Started Identify a specific care area: FALLS PREVENTION . Capture briefing on: - Data collection form or - Daily diary (specific heading). Test on a small scale and obtain feedback on the process (eg for one week on day shift). 2. Safety Briefings should be Inclusive and open All staff have something to share and learn.