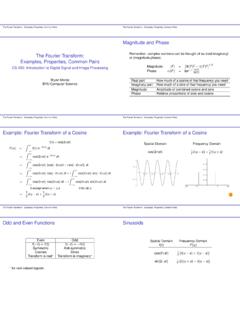
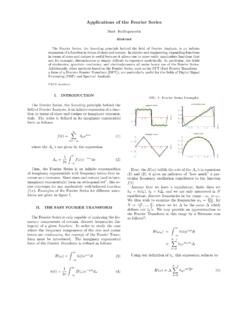
Transcription of FFT Spectrum Analysis (Fast Fourier Transform)
1 - Copyright 2000 - 2022 Dewesoft , all rights reserved. FFT Spectrum Analysis (Fast Fourier transform ). Additional information about FFT Analysis This training material will come around most topics of what is good to know in order to perform FFT Analysis with high efficiency. For additional information about FFT Analysis please look at the links below: FFT Analysis (Fast Fourier transform ): The Ultimate Guide to Frequency Analysis FFT analyzer Online (F1) help information Processing Markers Online (F1) help information FFT analyzer Application page 1.
2 What is frequency Analysis ? For cyclical processes, such as rotation, oscillations, or waves, frequency is defined as a number of cycles per unit of time. For counts per unit of time, the SI unit for frequency is hertz (Hz); 1 Hz means that an event repeats once per second. The time period (T) is the duration of one cycle and is the reciprocal of the frequency (f): What is frequency Analysis ? Frequency Analysis is just another way of looking at the same data. Instead of observing the data in the time domain, with some not very difficult, yet inventive mathematics frequency Analysis decomposes time data in the series of sinus waves.
3 We can also say that frequency Analysis checks the presence of certain fixed frequencies. The image below shows the signal, which consists of three sine waves with the frequencies of Hz, 1 Hz, and 2 Hz, and then on the right side the decomposed signal. Rec 1. sine(0,5) [-]. Rec t[s]. -1. +. 1. =. sine(1) [-]. signal [-]. 0. t[s]. -1. +. 1. sine(2) [-]. t[s]. t[s]. -1. 2. Just to make those sine waves better visible, let us show them in a nicer way. On the x-axis, there are frequencies and on the y-axis, there are amplitudes of the sine waves.
4 And this is really what the frequency Analysis is all about: showing the signal as the sum of sinus signals. And the understanding, how that works, helps us to overcome problems that it brings with it. 3. Fourier transform The mathematician Fourier proved that any continuous function could be produced as an infinite sum of sine and cosine waves. His result has far-reaching implications for the reproduction and synthesis of sound. A pure sine wave can be converted into sound by a loudspeaker and will be perceived to be a steady, pure tone of a single pitch.
5 The sounds from orchestral instruments usually consist of a fundamental and a complement of harmonics, which can be considered to be a superposition of sine waves of a fundamental frequency f and integer multiples of that frequency. Fourier Analysis of a periodic function refers to the extraction of the series of sines and cosines which when superimposed will reproduce the function. This Analysis can be expressed as a Fourier series. Fourier series Any periodic waveform can be decomposed into a series of sine and cosine waves: where a0, an, and bn are Fourier coefficients: , , Discrete Fourier transform For discrete data, the computational basis of spectral Analysis is the discrete Fourier transform (DFT).
6 The DFT transforms time-based or space-based data into frequency-based data. The DFT of a vector x of length n is another vector y of length n: 4. where w is a complex nth root of unity: We used i for the imaginary unit and p and j for indices that run from 0 to n-1. The indices p+1 and j+1 run from 1 to n. Data in the vector x are assumed to be separated by a constant interval in time or space, dt = 1/fs or ds = 1/fs, where fs is the sampling frequency. The DFT y is complex-valued. The absolute value of y at index p+1 measures the amount of the frequency (f = p(fs / n)) present in the data.
7 The first element of y, corresponding to zero frequency, is the sum of the data in x. This DC component is often removed from y so that it does not obscure the positive frequency content of the data. An example of this is the square wave in the picture below. A square wave is composed of an infinite summation of sinusoidal waves. Let's think about how the equation for discrete Fourier transform works: 5. To check the presence of a certain sine wave in a data sample, the equation does the following: 1. Multiplies the signal with a sine wave of that frequency which we want to extract.
8 The image below shows the signal (black line), which consists only of a sine wave with 50 Hz. We try to extract the 36 Hz on the left side and 50 Hz on the right side (they are shown as blue lines). Light blue filled wave shows multiplied values 2. Multiplied values are summed together and this is the main trick. If there is a component in a signal like in the right picture the multiplication of positive signal parts and extraction sine waves gives the positive result. Also, the multiplication of negative signal parts and negative extraction sine waves gives positive results (observe the right image).
9 In this case, the sum of the multiplied sine waves will be nonzero and will show the amplitude of the 50 Hz part of the signal. In the case of 36 Hz, there are both positive and negative sides of multiplication values and the sum will be (almost, as we will see further on) zero. 3. And that's it. That sum gives the estimate of the presence of frequencies in the signal. We check sine and cosine to get also phase shift (in the worst case if the phase shift would be 90 degrees, the sum of sine functions would always give zero).
10 The principle shown above can extract basically any frequency from the sine wave, but it has one disadvantage - it is awfully slow. The next important step in the usage of DFT was the FFT algorithm - this Analysis reduces the number of calculations by rearranging the data. The disadvantage is only that the data samples must be of length, which is the power of two (like 256, 512, 1024 and so on). Apart from that, the result is practically the same as for the DFT. 6. FFT - Fast Fourier transform Fast Fourier transform is a mathematical method for transforming a function of time into a function of frequency.