Transcription of Fidelity Advisor Growth Opportunities Fund 2021 REFINITIV ...
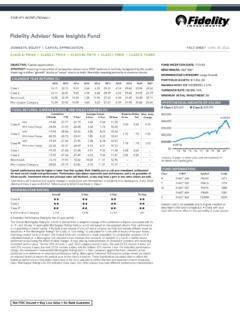
1 Not FDIC Insured May Lose Value No Bank GuaranteeFACT SHEET DECEMBER 31, 2021 Fidelity INSTITUTIONAL Fidelity Advisor Growth Opportunities FundCLASS A: FAGAX CLASS C: FACGX CLASS M: FAGOX CLASS I: FAGCX CLASS Z: FZAHXOBJECTIVE: Capital growthSTRATEGY: Investing in companies that FMR believes have above-average Growth potential (stocks of these companies are often called Growth stocks). Normally investing primarily in common YEAR RETURNS (%)2012201320142015201620172018201920202 021 Class RETURNS, EXPENSE RATIOS, AND SALES CHARGES (%)CumulativeAverage AnnualExpense RatiosMax.
2 Sales Charge3-MonthYTD1-Year3-Year5 -Year10 -YearGrossNetClass Sales Sales Sales Class Morningstar Current performance may be higher or lower than that quoted. Visit or call your investment professional for most recent month-end performance. Performance data shown represents past performance and is no guarantee of future results. Investment return and principal value will fluctuate, so you may have a gain or loss when shares are sold. Total returns are historical and include changes in share price and reinvestment of dividends and capital gains, if any.
3 On 2/1/07, the fund began comparing its performance to a different primary benchmark and adjusted its investments. Initial offering of Class Z was on 8/13/13. Returns prior to 8/13/13 are those of Class RATINGO verall3-Year5 -Year10 -YearClass A Class I Class Z # of Funds in Category1,1161,1161,012768 Extended Performance Rating for the 10-year Overall Morningstar Rating for a fund is derived from a weighted average of the performance figures associated with its 3-, 5-, and 10-year (if applicable) Morningstar Rating metrics, which are based on risk-adjusted returns.
4 Past performance is no guarantee of future results. Multiple share classes of a fund have a common portfolio but impose different expense structures. The Morningstar RatingTM for funds, or star rating, is calculated for funds with at least a three-year history. (Exchange traded funds and open-end mutual funds are considered a single population for comparative purposes.) It is calculated based on a Morningstar risk-adjusted return measure that accounts for variation in a fund s monthly excess performance (excluding the effect of sales charges, if any), placing more emphasis on downward variations and rewarding consistent performance.
5 The top 10% of funds in each fund category receive 5 stars, the next receive 4 stars, the next 35% receive 3 stars, the next receive 2 stars, and the bottom 10% receive 1 star. For extended performance ratings, the investment s independent Morningstar Rating metric is then compared against the fund universe s actual performance to determine its extended performance rating. Morningstar Extended Performance ratings shown are based on adjusted historical returns for periods prior to the class s inception. These hypothetical calculated returns reflect the historical performance of the oldest share class of the fund, adjusted to reflect the fees and expenses of each respective class.
6 Morningstar Rating is for the indicated share class only; other classes may have different performance INCEPTION DATE: 11/18 / 87 BENCHMARK: Russell 1000 GrowthMORNINGSTAR CATEGORY: Large GrowthPORTFOLIO ASSETS: $25, FEE (5/31/21): RATE (5/21): 70%MINIMUM INITIAL INVESTMENT: $0 HYPOTHETICAL Growth OF $10,000 Class I:$79,116 Class Z:$79,972$0$10,000$30,000$50,000$70,000$ 90,000 12 13 14 15 16 17 18 19 20 2112/30/1112/31/21 Includes changes in share price and reinvestment of dividends and capital INFORMATIONC lassCUSIPS ymbolCodeA315807834 FAGAX248C315807768 FACGX482M315807206 FAGOX168I315807883 FAGCX688Z315805242 FZAHX2533 Classes I and Z are available only to eligible investors as described in the fund s prospectus.
7 Check with your back office/home office on the availability of share classes.* Lipper determined the award winners by calculating the highest Consistent Return over the 10-year period ended 11/30/20. The Consistent Return measure takes into account both short and long-term risk-adjusted performance relative to fund classification. FA Growth Opportunities Fund competed with 97 Multi-Cap Growth Funds over the 10-year period to win the award. Lipper Fund Awards are based on Class I shares of the respective Fidelity Advisor fund. Other share classes may have different performance characteristics.
8 Fund performance may now be higher or lower than the performance that was calculated to win this award. Although Lipper makes reasonable efforts to ensure the accuracy and reliability of the data, the accuracy is not guaranteed by Lipper Awards from REFINITIV , 2021 REFINITIV . All rights reserved. Used under EQUITY | GROWTH2021 REFINITIV LIPPER FUND AWARD WINNER: BEST FUND 10 YEARS* Fidelity DISTRIBUTORS COMPANY LLC500 SALEM STREET, SMITHFIELD, RI 02917 Personal and Workplace brokerage products provided by Fidelity Brokerage Services LLC, Member NYSE, SIPC, 900 Salem Street, Smithfield, RI investing, consider the fund s investment objectives, risks, charges, and expenses.
9 Contact your investment professional or visit for a prospectus or, if available, a summary prospectus containing this information. Read it Advisor Growth Opportunities FundStock markets, especially foreign markets, are volatile and can decline significantly in response to adverse issuer, political, regulatory, market, or economic developments. Foreign securities are subject to interest rate, currency exchange rate, economic, and political risks. Growth stocks can perform differently from other types of stocks and the market as a whole and can be more volatile than other types of NCUA or NCUSIF insured.
10 May lose value. No credit union The top 10 holdings, sector diversification, asset allocation, and regional diversification may not be representative of the fund s current or future investments and may change at any time. Top 10 holdings do not include money market instruments and/or futures contracts. Depositary receipts are normally combined with the underlying security. 2. As a percentage of total net assets. 3. Net Other Assets can include fund receivables, fund payables, and offsets to other derivative positions, as well as certain assets that do not fall into any of the portfolio composition categories.