Transcription of Fidelity Global Balanced Portfolio
1 FUND FACTS. Fidelity INVESTMENTS CANADA ULC. Fidelity Global Balanced Portfolio Series B, E1, E2, E3, E4 and E5. NOVEMBER 1, 2018. This document contains key information you should know about Fidelity Global Balanced Portfolio - Series B, E1, E2, E3, E4 and E5 (the Fund ). You can find more detailed information in the Fund's simplified prospectus. To get a copy, ask your representative, contact Fidelity Investments Canada ULC. ( Fidelity ) at 1-800-263-4077 or or visit Before you invest in any fund, you should consider how it would work with your other investments and your tolerance for risk.
2 QUICK FACTS*. FUND CODES CAD (ISC) FUND CODES USD (ISC) DATE SERIES STARTED TOTAL VALUE OF THE FUND ON SEPTEMBER 30, 2018 $ billion B 2204 n/a April 18, 2007 MANAGEMENT EXPENSE RATIO (MER) Series B : E1 4356 n/a February 5, 2016 FUND MANAGER Fidelity Investments Canada ULC. E2 4358 n/a February 5, 2016 Portfolio MANAGER Fidelity Investments Canada ULC. E3 4360 n/a February 5, 2016 DISTRIBUTIONS Annually, in mid to late December E4 4361 n/a February 5, 2016 MINIMUM INVESTMENT Series B : $500 initial, $25 additional E5 4362 n/a February 5, 2016.
3 * This document pertains to Series B, E1, E2, E3, E4 and E5 units available as part of the Fidelity Preferred Program (the Program ). See below under How Much Does It Cost? for further details about the Program. These amounts may change from time to time, and may also be waived by Fidelity . See Fund Expenses for the minimum investment thresholds and MERs for the other series of units in the Program and speak to your representative for details. WHAT DOES THE FUND INVEST IN? The Fund invests primarily in underlying funds including other Fidelity Funds and ETFs.
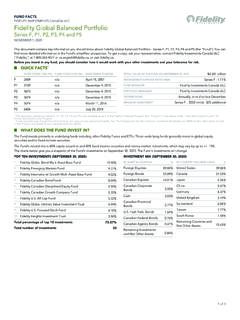
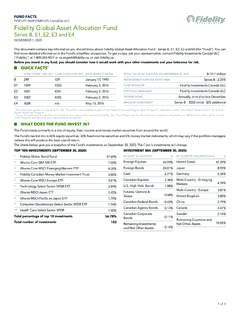
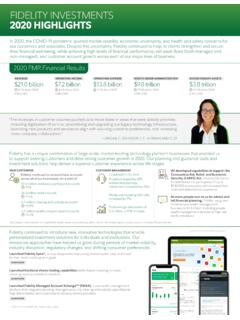
4 These underlying funds generally invest in Global equity securities and/or fixed income securities. The Fund's neutral mix is 60% equity securities and 40% fixed income securities and money market instruments, which may vary by up to +/- 15%. The charts below give you a snapshot of the Fund's investments on September 30, 2018. The Fund's investments will change. TOP TEN INVESTMENTS (SEPTEMBER 30, 2018) INVESTMENT MIX (SEPTEMBER 30, 2018). 1 Fidelity Global Bond Investment Trust BY ASSET ALLOCATION % BY COUNTRY (INCLUDES CASH) %.
5 2 Fidelity Global Bond Currency Neutral Investment Trust Foreign Equities United States 3 Fidelity All Cap Fund Foreign Bonds Canada 4 Fidelity Canadian Bond Fund Canadian Equities Cash & Cash Equivalents 5 Fidelity International Growth Investment Trust Cash & Short-Term Japan Investments 6 Fidelity Emerging Markets Fund United Kingdom Canadian Corporate 7 Fidelity Focused Stock Fund China Bonds 8 Fidelity Canadian Growth Company Fund Germany Canadian Provincial 9 Fidelity Global Intrinsic Value Investment Trust Bonds Switzerland 10 Fidelity Canadian Disciplined Equity Fund High Yield Bonds France Total percentage of top 10 investments Futures, Options & Remaining Investments Swaps and Net Other Assets Total number of investments 29.
6 Convertibles Remaining Investments and Net Other Assets 1 of 4. FUND FACTS. Fidelity Global Balanced Portfolio Series B, E1, E2, E3, E4 and E5. HOW RISKY IS IT? The value of the Fund can go down as well as up. You could lose money. RISK RATING. One way to gauge risk is to look at how much a fund's returns change Fidelity has rated the volatility of this Fund as low to medium. This rating over time. This is called "volatility". is based on how much the Fund's returns have changed from year to year. It doesn't tell you how volatile the Fund will be in the future.
7 The In general, funds with higher volatility will have returns that change more rating can change over time. A fund with a low risk rating can still lose over time. They typically have a greater chance of losing money and may money. have a greater chance of higher returns. Funds with lower volatility tend to have returns that change less over time. They typically have lower . returns and may have a lower chance of losing money. LOW LOW TO MEDIUM MEDIUM TO HIGH. MEDIUM HIGH. For more information about the risk rating and specific risks that can affect the Fund's returns, see the What are the risks of investing in the fund?
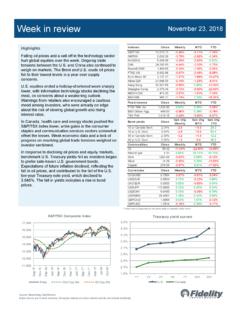
8 ' section of the Fund's simplified prospectus. NO GUARANTEES. Like most mutual funds, this Fund doesn't have any guarantees. You may not get back the amount of money you invest. HOW HAS THE FUND PERFORMED? This section tells you how series B units of the Fund have performed over the past 10 years. Returns are after expenses have been deducted. These expenses reduce the Fund's returns. The performance of Series E1, E2, E3, E4 and E5 units would be similar to the performance of Series B, but would vary mainly as a result of the difference in the combined management and administration fees compared to Series B, as set out in the fee decrease table under Fund Expenses below.
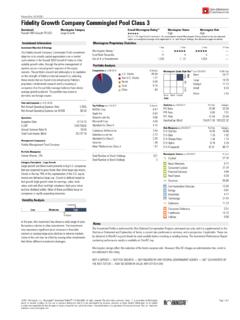
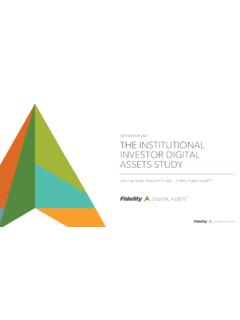
9 YEAR-BY-YEAR RETURNS BEST AND WORST 3-MONTH RETURNS. This chart shows how series B units of the Fund performed in each of the This table shows the best and worst returns for series B units of the Fund past 10 years. The Fund dropped in value in 2 of the 10 years. The range in a 3-month period over the past 10 years. The best and worst 3-month of returns and change from year to year can help you assess how risky the returns could be higher or lower in the future. Consider how much of a Fund has been in the past.
10 It does not tell you how the Fund will perform loss you could afford to take in a short period of time. in the future. IF YOU INVESTED. 30%. $1,000 AT THE. BEGINNING OF THE. 20% RETURN 3 MONTHS ENDING PERIOD. 10%. Your investment 0% Best return May 31, 2009 would rise to $1,159. -10%. Your investment -20% Worst return November 30, 2008 would drop to $789. -30%. 2008 2009 2010 2011 2012 2013 2014 2015 2016 2017. AVERAGE RETURN. A person who invested $1,000 in series B units of the Fund 10 years ago now has $1,985.