Transcription of Fifty years of Australia’s trade - Department of Foreign ...
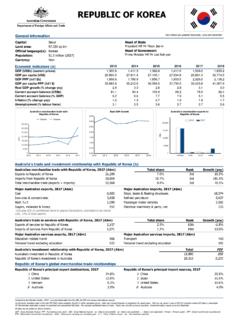
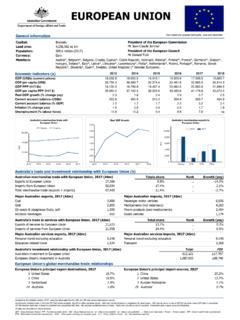
1 Fifty years of australia 's trade Introduction This edition of australia 's Composition of trade marks the publication's 50th anniversary. In recognition of this milestone, this article analyses changes in the composition of australia 's trade from the inaugural 1963-64. edition to today. It explores the overall trends and growth of import and export trade , the shifts in the countries we trade with and the commodities we trade . australia 's Composition of trade publication When the first Composition of trade was released by the Department of trade and Industry in 1964, trade constituted per cent of australia 's Gross Domestic Product (GDP) with two-way goods and services trade at $ billion 1.
2 trade now constitutes per cent of GDP and two-way trade has increased to $ billion 2. The first Composition of trade publication was a 21 page, single sided booklet with basic content, covering merchandise trade and direction of trade for exports. Today, the Department of Foreign Affairs and trade publishes a suite of products and time series data on a financial year and calendar year basis. The data published includes: australia 's two-way goods and services trade by commodity; breakdowns by country and country groups; australia 's rank in world trade ; commodity forecasts and more.
3 The data can be found on the trade and economic statistics page on the DFAT website ( ). Financial year 1963-64 Financial year 2013-14. Pattern of trade Composition of trade . Part 2 Composition of trade . 1 In 1963-64 prices (Australian pounds have been converted to dollars at 1:2 ratio). 2 In 2013-14 prices. Fifty years of australia 's trade 1. Overall export trends In the Fifty years from 1963-64 to 2013-14, australia 's exports of goods and services grew from $ billion to $ billion in value terms, representing an annual average growth of per cent ( per cent in volume terms).
4 Through the 1960s, export growth was driven by the post war commodities boom and a reduction of trade barriers following four post-war General Agreement on Tariffs and trade 3 negotiating rounds. Export growth averaged per cent per annum in value terms ( per cent in volume terms). In the 1970s, export growth was particularly strong in value terms (averaging per cent per annum) due to high global inflation brought on, in part, by the 1973 oil crisis. At the same time, competition in australia 's traditional export markets (as the United Kingdom increased trade ties with Europe) slowed volume growth to an average of per cent per annum.
5 A$b Chart 1: australia 's goods & services exports 1963-64 to 1989-90. 100. Deregulation of the Aust. economy 90. 80. 70. 60. Post war boom 50. 40. 30. 20. 10. 0. Values Volumes Based on ABS Balance of Payments and International Investment Position, September 2014. A$b Chart 2: australia 's goods & services exports 1989-90 to 2013-14. 350. Global 300 financial crisis 250. 200. Resources 150. commodity boom 100. 2000 Olympics /. AUD depreciation 50. 0. Values Volumes Based on ABS Balance of Payments and International Investment Position, September 2014.
6 3 General Agreement on Tariffs and trade members became the founders of the World trade Organization in 1995. Fifty years of australia 's trade 2. Economic deregulation during the 1980s and 1990s opened australia 's economy to the world and combined with new investment and global demand, contributed to strong export growth that continued over the next two decades. Growth through the period averaged per cent per annum in value terms and volume growth recovered to per cent per annum. Export growth spiked in the early 2000s due to depreciation of the Australian dollar and the 2000 Sydney Olympic Games.
7 From 2003-04 increased commodity prices with the resource commodity boom resulted in average annual value growth of per cent in the ten years since ( per cent in volume terms), a strong growth rate even through the global financial crisis. The direction of merchandise exports In 1963-64, the United Kingdom was australia 's largest merchandise export destination 4. At the time however, the United Kingdom was enhancing their trade relationships with their neighbours in Europe (having joined the European Free trade Association in 1960), whilst australia was enhancing ties with Asia.
8 In 1966-67, Japan became our leading merchandise export destination and remained so until overtaken by China in 2009-10. By 2013-14, Asia accounted for per cent of australia 's merchandise exports, up from just per cent in 1963-64 (see Chart 3). Chart 3: Direction of merchandise exports by country/region 1963-64 2013-14. Other (incl. United Other (incl. United Oceania &. Africa) States Africa) States Antarctica Other Other Oceania & Other Americas Americas Antarctica Europe China United Kingdom Other China Europe Other Asia Japan United Kingdom Other Asia Japan Based on ABS Overseas trade , 1963-64.
9 Based on ABS trade data on DFAT STARS database and unpublished ABS data. The composition of exports The commodities australia exports have also changed significantly. In 1963-64 and through to the early 1980s, rural commodities such as Wool and Wheat dominated Australian exports (see Table 1). The shift toward mineral and fuel exports began in the 1970s and was driven by Iron ore and Coal. Services exports increased in significance in the late 1980s. Personal travel became a major export with short term visitor arrivals into australia increasing from around 137,000 in 1963-64 to over million in 1991-92 5.
10 The growing contribution of both resources and services created a diverse composition of exports from the late 1980s to the early 2000s (see Chart 4), reducing australia 's reliance on rural exports. 4 Services trade by country is not available prior to 1987-88. 5 DFAT estimates. Fifty years of australia 's trade 3. Table 1: australia 's top 5 exports of goods and services (a). 1963-64 and 2013-14 comparison 1963-64 2013-14. A$m % share A$m % share Total (b) 2,786 Total (b) 331,184. Wool 962 Iron ores & concentrates 74,684 Wheat 362 Coal 39,965 Transport services (c) 258 Natural gas 16,305 Education-related travel services Beef and veal 154 (d) 15,743 Personal travel (excl education).